Dashboards

Grafana Alerting: Searching for Grafana alerts just got faster, easier, and more accurate

Grafana Alerting enables users to create and customize alert rules as separate entities and link them to Grafana panels. It also supports various data sources with built-in alerting engines, such as Prometheus, Grafana Mimir, and Grafana Loki, allowing users to manage their alert rules directly from Grafana’s UI.

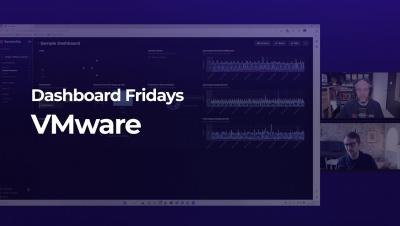
Dashboard Fridays: Sample VMware dashboard

These three VMware dashboards built in SquaredUp provide a full overview of the data in a VMware deployment so users can spot performance issues and fix them fast. Having all the VM performance and health metrics in one place – for your VMs, VM hosts, and guest VMs – allows engineers to pre-empt issues and fix them before they become problems for end users.

How to collect and query Kubernetes logs with Grafana Loki, Grafana, and Grafana Agent

Logging in Kubernetes can help you track the health of your cluster and its applications. Logs can be used to identify and debug any issues that occur. Logging can also be used to gain insights into application and system performance. Moreover, collecting and analyzing application and cluster logs can help identify bottlenecks and optimize your deployment for better performance.

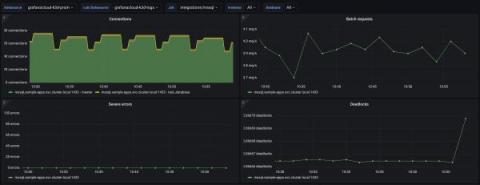
How to monitor Microsoft SQL Server performance with Grafana Cloud

A database is one of the most critical components for almost every application. Making sure it is running with the expected read and write latencies is paramount. This can be the difference between a smooth, pleasing user experience and a slow, error-filled one that makes your customers turn their back on a product — and never come back.

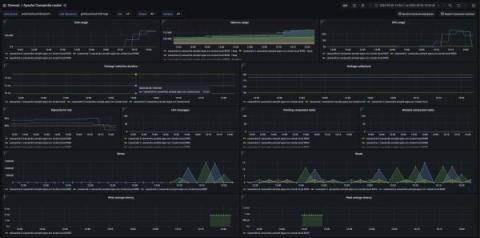
How to get started with monitoring Apache Cassandra with Grafana Cloud

Apache Cassandra is a highly scalable, open source NoSQL database system designed to handle large amounts of data across multiple commodity servers with no single point of failure. Apache Cassandra can be run as a single node but starts making sense when its run in a cluster setup. The system is optimized for high write throughput and is known for its ability to handle big data workloads with ease at super-low latencies.

Scrape Azure metrics and monitor AKS using Grafana Agent

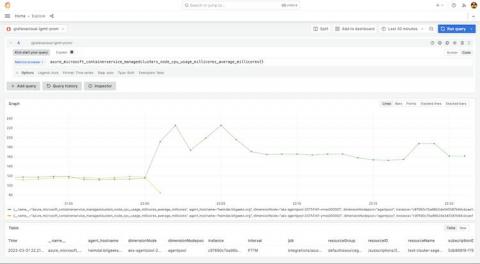
As more organizations adopt cloud-based services like Microsoft Azure Kubernetes Service (AKS), it becomes increasingly important to monitor and manage the performance and reliability of these services. If you’re using AKS today, then Grafana Cloud provides the flexibility, performance, and visualizations you need to monitor your distributed applications.

Grafana Loki 2.8 release: TSDB GA, LogQL enhancements, and a third target for scalable mode

Grafana Loki 2.8 is here — and it’s at least 0.1 better than Loki 2.7! Jokes aside, this release includes a number of improvements users will appreciate. In addition to graduating our TSDB index from Experimental to General Availability, we’ve added a number of nifty LogQL features, and we’ve made the Loki deployment and management experience much easier. This also marks the release of Grafana Enterprise Logs (GEL) 1.7.

Grafana Alerting: A beginner's guide to templating alert notifications

We often see questions about how to template alerts. In Grafana, you can template information about your alerts with custom labels and annotations, and you can also template how notifications look and what information they contain with notification templates. Many users confuse the two, despite being separate features with different use cases.

MetricFire - Dashboards Tutorial

In this video, we explore MetricFire’s powerful dashboarding platform. Discover how to customize your dashboard to view the metrics that matter most to your business. With a variety of visualization options and an intuitive interface, creating and editing charts, tables, and graphs has never been easier. Share your dashboard with your team and keep everyone on the same page. Join MetricFire and start tracking your business metrics today.