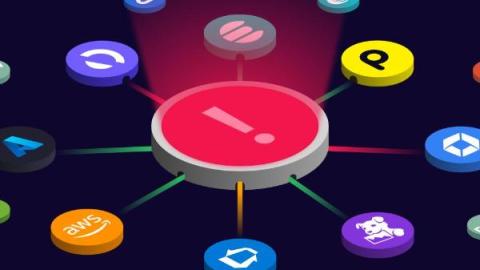
A dive into health roll-up
SquaredUp's awesome dashboards sit on top of some very powerful technology. In this post, I'll explain just what that means and how it can benefit you.
Grafana Cloud security: Three common cloud security myths debunked
Grafana Cloud offers organizations an end-to-end observability platform, without the overhead of building and maintaining their own observability stack. We’re constantly shipping new Grafana Cloud features to ensure users get the most out of the fully managed platform, which is powered by our open source Grafana LGTM Stack (Loki for logs, Grafana for visualization, Tempo for traces, and Mimir for metrics).
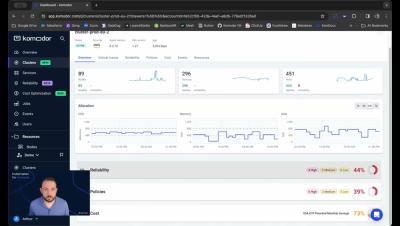
Introducing Komodor's Clusters Dashboard
Arthur Enright, Senior Solution Engineer, presenting Komodor's mission control for platform teams - the clusters dashboard.
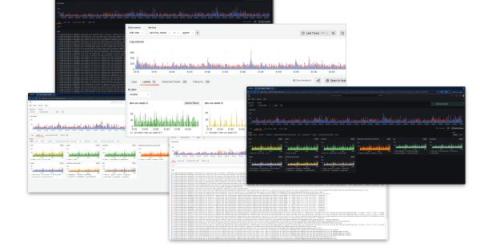
Grafana 11 release: The latest in visualizations, Scenes-powered dashboards, simple access controls, and more
At the opening keynote of GrafanaCON 2024, attendees in Amsterdam got a sneak peek at some of the latest features in Grafana 11, which is now available in preview. Grafana: download now! For those of you who couldn’t score a ticket to the sold-out event, don’t worry — we have a roundup of all the latest updates to visualizations that make it easier than ever to create beautiful dashboards in Grafana.
GrafanaCON 2024: A guide to all the announcements from Grafana Labs
Tulips in bloom. Sunny bike rides. The latest observability trends. All signs point to springtime in Amsterdam, where Grafana Labs is thrilled to host GrafanaCON 2024 in person for the first time in five years.
Loki 3.0 release: Bloom filters, native OpenTelemetry support, and more!
Welcome to the next chapter of Grafana Loki! After five years of dedicated development, countless hours of refining, and the support of an incredible community, we are thrilled to announce that Grafana Loki 3.0 is now generally available. The journey from 2.0 to 3.0 saw a lot of impressive changes to Loki. Loki is now more performant, and it’s capable of handling larger scales — all while remaining true to its roots of efficiency and simplicity.
Find your logs data with Explore Logs: No LogQL required!
We are thrilled to announce the preview of Explore Logs, a new way to browse your logs without writing LogQL. In this post, we’ll cover why we built Explore Logs and we’ll dive deeper into some of its features, including at-a-glance breakdowns by label, detected fields, and our new pattern detection. At the end, we’ll tell you how you can try Explore Logs for yourself today. But let’s start from the beginning — with good old LogQL.
Introducing an OpenTelemetry Collector distribution with built-in Prometheus pipelines: Grafana Alloy
In the opening keynote of GrafanaCON 2024, we announced our newest OSS project: Grafana Alloy, our open source distribution of the OpenTelemetry Collector. Alloy is a telemetry collector that is 100% OTLP compatible and offers native pipelines for OpenTelemetry and Prometheus telemetry formats, supporting metrics, logs, traces, and profiles. Some of you may be thinking: Wait, another collector?
SQUPCAST Ep. 1: Welcome, what's new, what's coming
We're kicking off SQUPCAST with some introductions, and a wholesome chat with our product managers who'll show off all the new features and plugins we've added to SquaredUp in the last month.


