Operations | Monitoring | ITSM | DevOps | Cloud
The latest News and Information on Databases and related technologies.
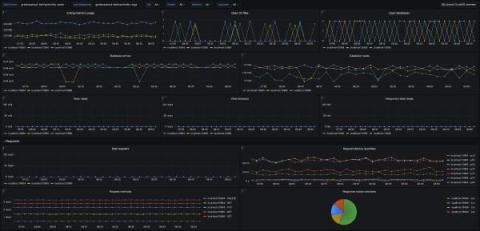
How to monitor an Apache CouchDB cluster with Grafana Cloud
We’re excited to introduce a dedicated Grafana Cloud integration for Apache CouchDB, a NoSQL document database that stores data in a JSON-based document format. Known for its scalability, availability, and easy replication of data across multiple servers, Apache CouchDB comes with a whole host of features designed to make it easy to run resilient distributed systems, with built-in bi-direcitonal replication allowing for simple replication across multiple servers and data centers.
Top 10 Contact Database Providers for Your Sales and Marketing Needs
Smarter Database Monitoring: Tackling Performance Hiccups and Leveraging Data for Success
The cloud is the hub for data management nowadays. DevOps teams are all about preventing any hiccups that could make customers unhappy. And with more companies moving to cloud databases and services like SnowFlake, Redshift, RDS, and BigQuery, they’re operating on a bigger scale with better quality.
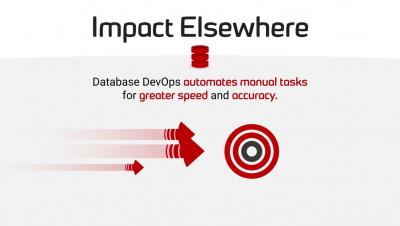
Enterprise businesses that adopt Database DevOps save an average of $4.3M per year
The Carbon Daemons: Graphite monitoring
Graphite is a powerful open-source time series database used for storing, retrieving, and visualizing changing numeric data points over time. With its robust monitoring system, Graphite can efficiently handle large data loads without compromising performance. In this article, we delve into the basics of Graphite, focusing on its primary component, Carbon.
VictoriaMetrics bolsters move from monitoring to observability with VictoriaLogs release
Today we’re happy to announce our new open source, scalable logging solution, VictoriaLogs, which helps users and enterprises expand their current monitoring of applications into a more strategic ‘state of all systems’ enterprise-wide observability. Many existing logging solutions on the market today offer IT professionals a limited window into live operations of databases and clusters.


