Operations | Monitoring | ITSM | DevOps | Cloud
The latest News and Information on Databases and related technologies.
Save network costs with VictoriaMetrics remote write protocol
Prometheus remote write protocol is used by Prometheus for sending data to remote storage systems such as VictoriaMetrics. See these docs on how to setup Prometheus to send the data to VictoriaMetrics. This protocol is very simple - it writes the collected raw samples into WriteRequest protobuf message, then compresses the message with Snappy compression algorithm and sends it to the remote storage in an HTTTP POST request.
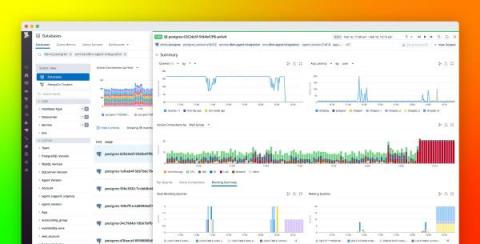
Troubleshoot blocking queries with Datadog Database Monitoring
Blocked queries are one of the key issues faced by database analysts, engineers, and anyone managing database performance at scale. Blocking can be caused by inefficient query or database design as well as resource saturation, and can lead to increased latency, errors, and user frustration. Pinpointing root blockers—the underlying problematic queries that set off cascading locks on database resources—is key to troubleshooting and remediating database performance issues.
Flyway Desktop and MySQL
How to Monitor Redis with Prometheus
The current popularity of Redis is well deserved; it’s one of the best caching engines available and it addresses numerous use cases – including distributed locking, geospatial indexing, rate limiting, and more. Redis is so widely used today that many major cloud providers, including The Big 3 — offer it as one of their managed services. In this article, we’ll look at how to monitor Redis performance using Prometheus, the similarly popular open-source monitoring system.
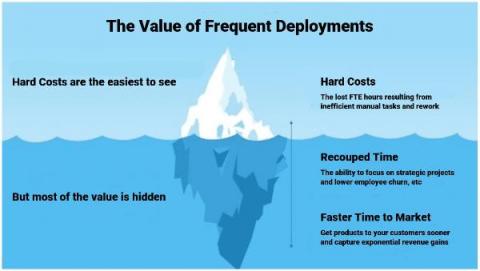
The business value of frequent deployments: Faster time to market
How Database Observability Increases Operational Reliability
Next Level Oracle Monitoring: Options, Features, Deep-Dive
Get a guided tour on advanced Oracle monitoring based on Microsoft System Center Operations Manager.
Next Level Oracle Monitoring Options Features DeepDive NiCE 2023Q1
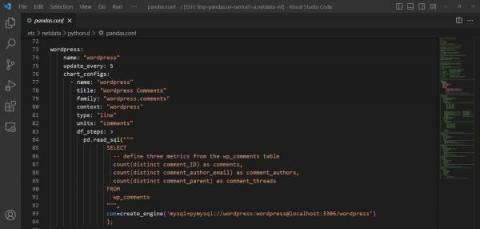
Monitor any SQL metrics with Netdata (and Pandas )
We recently got this great feedback from a dear user in our Discord: This is great and exactly what we want, a clear problem or improvement we could make to help make that users monitoring life a little easier. This is also where the beauty of open source comes in and being able to build on the shoulders of giants - adding such a feature turned out to be pretty easy by just extending our existing Pandas collector to support SQL queries leveraging its read_sql() capabilities.


