Operations | Monitoring | ITSM | DevOps | Cloud

The latest News and Information on DevOps, CI/CD, Automation and related technologies.

Sponsored Post

What Are Runbooks and How Does It Apply to Network Operation Centers (NOCs)?

Much like in other production environments, the production of cloud services is based on and orchestrated by a plethora of tools-making part of cloud services' overall cloud infrastructure. Given how cloud services are as complex as they are intricate, a vast range of detailed steps need to be performed in a certain order for the production environment to run smoothly, whether it's carrying out maintenance procedures, updates and upgrades, or resolving issues to prevent downtime.

How to get complete CI/CD pipeline observability

It's not like it used to be back in the day! Before CI/CD, we were building on-premises, service-oriented products following system style architecture and we were able to map out the build system and end-to-end process in a PowerPoint or Visio document. Although time-consuming and inefficient, it was relatively straightforward and the build pipeline was unlikely to change drastically. But that's no longer the case.

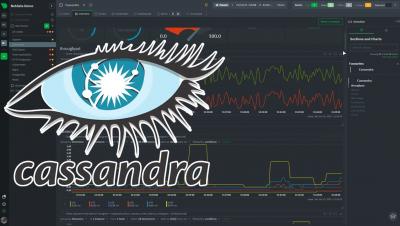
PostgreSQL Monitoring Upgrade

Netdata for PostgreSQL monitoring just got a huge upgrade, collecting 100+ PostgreSQL metrics and displaying these across 60+ different composite charts. You can check the reference documentation for the full list of metrics, and see them running live in the demo space. If you are using PostgreSQL in production, it is crucial that you monitor it for potential issues. And the more comprehensive the monitoring the better!

Scorecards for Resources

Cortex’s Resource Catalog allows engineers to track all of their infrastructure components — from databases to Kafta topics — in a single place. The Resource Catalog demystifies infrastructure, giving developers clear insights into exactly how their service architecture works. Using the Resource Catalog, it’s easy to find information about which infrastructure assets are running and how all the distinct components connect.

IoT project lifecycle: App-centric software development [Part II]

The traditional embedded Linux development model ties applications to the OS. Such a constraint means apps have to target a specific release, which lowers development velocity. Furthermore, broken upgrades in one part of the device may affect refreshes in the rest of the OS. On the other hand, embedded developers are increasingly looking at open-source software to enable rapid app-centric software deployment and global collaboration.

Load Testing: How Fast Can We Go?

Speedscale creates load tests from recorded traffic so generating load is pretty core to what we do. As a brief overview, we record traffic from your service in one environment and replay it in another, optionally increasing load several fold. During a replay the Speedscale load generator makes requests against the system under test (SUT), with the responses from external dependencies like APIs or a payment processor optionally mocked out for consistency. Your service is the SUT here.

Part 6: Observability Maturity Model Summary

For decades, IT operations teams have relied on monitoring for insight into the availability and performance of their systems. But the shift to more advanced IT technologies and practices is driving the need for more than monitoring – and so observability evolved. With infrastructures and applications that span multiple dynamic, distributed and modular IT environments, organizations need a deeper, more precise understanding of everything that happens within these systems.