Operations | Monitoring | ITSM | DevOps | Cloud

How to use Grafana Beyla in Grafana Alloy for eBPF-based auto-instrumentation

At GrafanaCON last month, we announced Grafana Alloy, our open source distribution of the OpenTelemetry Collector. Alloy is a telemetry collector that is 100% OTLP compatible and offers native pipelines for OpenTelemetry and Prometheus telemetry formats, supporting metrics, logs, traces, and profiles. Today, we are excited to share that Grafana Beyla is now available in Grafana Alloy as the default eBPF-based application auto-instrumentation solution.

Accelerate incident resolution with Advanced Insight

The common thread among teams responsible for maintaining IT services is their reliance on a deep understanding of the IT environment. Teams need access to all types of critical data to keep systems running. While it seems straightforward, ITOps teams face many challenges in locating, accessing, and synthesizing enough data to fully understand an incident’s cause and establish a remediation plan.

DISA STIGs: Who Needs Them & How to Enforce DISA STIG Compliance

DISA STIGs are an important compliance standard. There’s a security technical implementation guide (STIG) for almost every kind of technology in an IT environment, and each STIG can include hundreds of individual settings, configurations, and recommendations for ensuring compliance and security.

Best practices for using DORA metrics to improve software delivery

Software development and delivery requires cross-team collaboration and cross-service orchestration—all while ensuring that organizational standards for quality, security, and compliance are consistently met. Without careful monitoring, you risk a lack of visibility into delivery workflows, making it difficult to evaluate how they impact release velocity and stability, developer experience, and application performance.

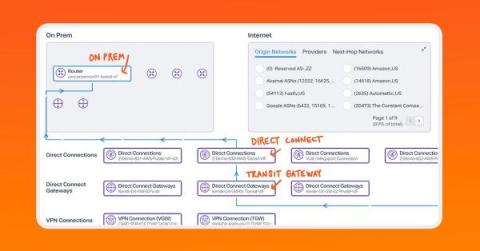
The Importance of Hybrid Cloud Visibility

Hybrid cloud environments, combining on-premises resources and public cloud, are essential for competitive, agile, and scalable modern networks. However, they bring the challenge of observability, requiring a comprehensive monitoring solution to understand network traffic across different platforms. Kentik provides a unified platform that offers end-to-end visibility, crucial for maintaining high-performing and reliable hybrid cloud infrastructures.

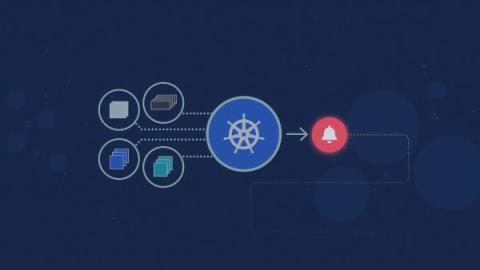
Kubernetes Alerting: 10 Must-Have Alerts for Proactive Monitoring

Running a Kubernetes cluster includes keeping an eye on it to make sure your apps and services are healthy. You don’t want to be staring at a bunch of Kubernetes dashboards all day, though. You want to set up kubernetes alerting with appropriate alerts instead, right? With k8s alerts, you will spot problems quickly in your Kubernetes cluster and hopefully fix them quickly as well. But what should you alert on? Here are the top 10 most important alerts you should set up for your Kubernetes cluster.

A Brief Look at How Technological Advancements Are Expanding Borrowers' Choices

Technological advancements are reshaping various sectors, with the financial industry being no exception. One of the most remarkable shifts is seen in the lending and borrowing domain. Traditionally dominated by banks and credit unions, this sector now boasts an array of innovative platforms and tools that empower borrowers like never before. From online lending marketplaces to sophisticated algorithms predicting creditworthiness, the borrowing landscape is becoming more accessible, transparent, and diversified.