Operations | Monitoring | ITSM | DevOps | Cloud

Latest Blogs

Monitoring Kubernetes Clusters on GKE (Google Container Engine)

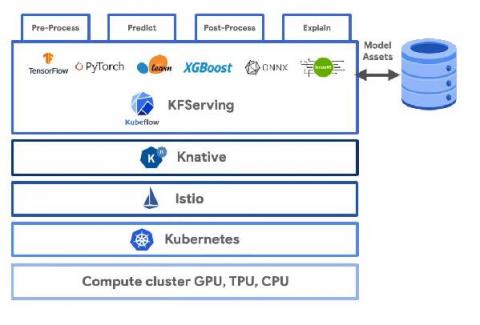
The Kubernetes ecosystem contains a number of logging and monitoring solutions. These tools address monitoring and logging at different layers in the Kubernetes Engine stack. This document describes some of these tools, what layer of the stack they address, as well as best practices for implementation including an example from the field, a quick start, and a demo project.

Downsampling and Exporting Stackdriver Monitoring Data

Stackdriver Monitoring contains a wealth of information about cloud resource usage, both for Google Cloud Platform (GCP) and and other sources. This post will explain how to use the Stackdriver Monitoring API to read, downsample, and export data from Stackdriver to BigQuery. Pub/Sub metrics will be used to demonstrate this.

Why Your Website Needs Uptime Monitoring in 2019

When a visitor types your website into the search bar, they intend to see your website and not a broken link/webpage. In a digital world where we want everything right now, a website that is not available right now is a website we probably will not go back to in the future. That much should be obvious to everyone. If you are not careful, your website could be sending your visitors to your competitors. So how do you keep track of your website 24/7? One answer is to use an uptime monitoring service.

Why is the Application Slow? Prove It's NOT the Network!

The one complaint that an IT administrator dreads to receive is one where an end user says, “My application is slow!”. The application in question can be a web application, an enterprise application like SAP, Microsoft SharePoint, or a SaaS application like Salesforce or Office 365. Since the application is accessed over a network, it’s natural that the network team is pulled up first under the suspicion that it’s a network issue.

Budget Planning for Next-generation APM and Observability

If you’re trying to evaluate and understand the ROI of building an observability practice and carve out a budget for it, you’re not alone. You’ve probably got some monitoring and metrics capability already, but that’s proving to not be enough–how can you empower your teams as your environment becomes too complex for the basics? And how much will that cost?

Searching for Actionable Signals: A Closer Look at Time Series Data Anomaly Detection

Simple enough to be embedded in text as a sparkline, but able to speak volumes about your business, time series data is the basic input of Anodot’s automated anomaly detection system. This article begins our three-part series in which we take a closer look at the specific techniques Anodot uses to extract insights from your data.