Operations | Monitoring | ITSM | DevOps | Cloud

Latest Posts

Kubernetes observability tutorial: K8s cluster setup and demo app deployment

The easiest way to get the Elastic Stack up and running for this tutorial, is to spin up a 14-day free trial of our Elasticsearch Service on Elastic Cloud. A few clicks (no credit cards) and you’ll have your cluster up and running. Or if you prefer, download the Elastic Stack and install locally. All of the instructions in this tutorial can be easily amended to work with a standalone Elasticsearch cluster on your own hardware.

Machine learning in cybersecurity: Training supervised models to detect DGA activity

How annoying is it when you get a telemarketing call from a random phone number? Even if you block it, it won’t make a difference because the next one will be from a brand new number. Cyber attackers employ the same dirty tricks. Using domain generated algorithms (DGAs), malware creators change the source of their command and control infrastructure, evading detection and frustrating security analysts trying to block their activity.

Elastic Cloud roundup: API support, more regions, and new purchasing options

You can now benefit from even more features and functionality in Elastic Cloud. In case you missed it, we’ve added powerful tools to simplify and automate operations. We’ve added support for more regions. And we’ve even added new ways to pay for, and understand your bill for Elastic Cloud. With a cup of tea and five minutes, we’ll recap them for you.

Telecommunications observability with the Elastic Stack: Monitoring voice traffic data

Applying an observability strategy to core telecommunication data processing enables operators to answer questions that were not possible to answer before. As this approach has gained prominence, the Elastic Stack has become increasingly popular in the telecommunications space, with companies like Deutsche Telekom — their data transformation effort championed by Hans-Konrad Roth — adopting Elastic as their solution of choice for international traffic monitoring.

Calculating ingest lag and storing ingest time in Elasticsearch to improve observability

When viewing and analysing data with Elasticsearch, it is not uncommon to see visualizations and monitoring and alerting solutions that make use of timestamps that have been generated on remote/monitored systems. However, using remote-generated timestamps may be risky.

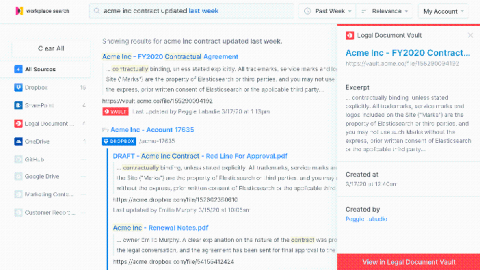
Searching Jira: Enhanced productivity with Elastic Workplace Search

Jira has long been a popular issue tracking tool for development teams, but its scope has broadened quite a bit over the years, and it has bloomed into a more well-rounded project management tool as well. It’s used widely by agile teams to plan, track, and release software, along with numerous other cloud (and traditional self-managed) productivity tools.

Real-time monitoring of Fastly metrics with the Elastic Stack and Haskell

The Stack Infra team at Elastic uses many services to provide downloads for projects like Elasticsearch and Kibana to our users. One of these services is Fastly, which helps us optimize delivery to regions around the world. Keeping an eye on the performance and behavior of our CDN is important to ensure we're operating at the level we expect.

Integrating Azure single sign-on with ECE in 1-2-3 at STRABAG

At STRABAG, we are using Elastic Cloud Enterprise (ECE) for two main use cases within our on-premises web applications. One to power different kinds of search and a second for operations where we ship more than 25,000 log entries per minute to Elastic from our load balancers. The ECE platform runs in an air-gapped environment, and we would still like to be able to use our corporate logins for the ECE platform.