Operations | Monitoring | ITSM | DevOps | Cloud

Latest Posts

Grafana Agent v0.31 release: new Helm chart, Flow support for Grafana Phlare, and more

Here at Grafana Labs, we aim to create products which integrate well with open standards and are easy to install everywhere. Today, we’re excited to announce Grafana Agent v0.31, which allows you to connect to even more types of observability signals for both scraping and remote writes. And to help you install the Agent more easily, there is now an official Windows Docker image and an official Helm Chart. Here’s a breakdown of the latest features and upgrades in Grafana Agent v0.31.

A beginner's guide to Kubernetes application monitoring

Application performance monitoring (APM) involves a mix of tools and practices to track specific performance metrics. Engineers use APM to monitor and maintain the health of their applications and ensure a better user experience. This is crucial to high quality architecture, development, and operations, but it can be difficult to achieve in Kubernetes since the container orchestration system doesn’t provide an easy way to monitor application data like it does for other cluster components.

Distributed tracing in Kubernetes apps: What you need to know

Kubernetes makes it easier for businesses to automate software deployment and manage applications in the cloud at scale. However, if you’ve ever deployed a cloud native app, you know how difficult it can be to keep it healthy and predictable. DevOps teams and SREs often use distributed tracing to get the insights they need to learn about application health and performance.

Monitoring Kubernetes layers: Key metrics to know

Kubernetes monitoring can be difficult and complex. In order to determine the health of your project at every level, from the application to the operating system to the infrastructure, you need to monitor metrics in all the different layers and components — services, containers, pods, deployments, nodes, and clusters.

Five eye-catching Grafana visualizations used by Energy Sciences Network to monitor network data

ESnet (Energy Sciences Network) is a high-performance network backbone built to support scientific research. Funded by the U.S. Department of Energy and part of Lawrence Berkeley National Laboratory, ESnet provides fast, reliable connections between national laboratories, supercomputing facilities, and scientific instruments around the globe. Our mission is to allow scientists to collaborate and perform research without worrying about distance or location.

How to use Kubernetes events for effective alerting and monitoring

Kubernetes, a graduated project of the Cloud Native Computing Foundation (CNCF) ecosystem, is the most prominent and widely used container orchestration systems. It’s used to manage and deploy containers in a wide range of environments, from IoT devices based on Raspberry Pis to enterprise environments consisting of millions of services.

How to monitor Kubernetes clusters with the Prometheus Operator

Kubernetes has become the preferred tool for DevOps engineers to deploy and manage containerized applications on one or multiple servers. These compute nodes are also known as clusters, and their performance is crucial to the success of an application. If a Kubernetes cluster isn’t performing optimally, the application’s availability and performance will suffer, leading to unhappy users and even revenue loss.

How Grafana Labs unlocks the power of recruitment data with Grafana dashboards

As the recruitment team here at Grafana Labs, we used to struggle to get a comprehensive view of our recruitment data. We had multiple sources of information, but it was difficult to pool that information so we could see the big picture and identify trends and patterns that could help us hire the right talent in a highly competitive market.

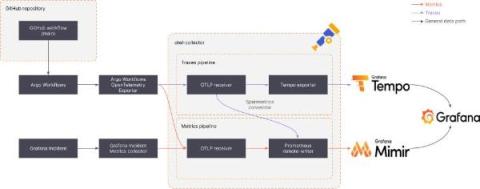
Reduce mean time to hello world with OpenTelemetry, Grafana Mimir, Grafana Tempo, and Grafana: Inside Adobe's observability stack

How is Grafana like an invisibility cloak? At Adobe, it’s one of just four tools they’re using to build observability directly into their CI/CD pipeline, making it essentially invisible — but nonetheless impactful — to thousands of developers across the organization who use it in their day-to-day lives.

Azure Managed Grafana users can now upgrade to Grafana Enterprise

In November 2021, we announced a strategic partnership with Microsoft to develop a Microsoft Azure managed service that lets customers run Grafana natively within their Azure cloud platform. Azure Managed Grafana, which became generally available in August 2022, makes it simple for Azure customers to deploy secure and scalable Grafana instances and connect to open source, cloud, and third-party data sources for visualization and analysis.