Operations | Monitoring | ITSM | DevOps | Cloud

What Is a ROADM?

A Reconfigurable Optical Add-Drop Multiplexer (ROADM) is a network element that selectively routes specific wavelengths of light across a fiber optic network without converting the signals into the electrical domain, forming the very foundation of modern optical transport networks. It allows operators to manage data traffic dynamically at the photonic layer. Fixed OADMs came first.

Infrastructure Monitoring Tools Enterprise IT Teams Should Evaluate in 2026

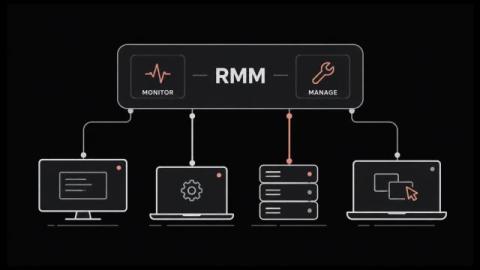
As enterprise IT environments become increasingly distributed, monitoring infrastructure performance is more challenging than ever. Organizations must manage on-premises systems, cloud services, virtualized environments, databases, networks, containers, and digital workspaces from a unified operational framework. This growing complexity has elevated the importance of modern infrastructure monitoring tools that provide end-to-end visibility, proactive alerting, and intelligent diagnostics.

Best Synthetic Monitoring Tools for Citrix, Web Apps & Digital Workspaces

Employee productivity and customer satisfaction depend on the consistent performance of digital workspaces, virtual desktops, web applications, and SaaS platforms. While reactive monitoring identifies issues after users experience them, synthetic monitoring tools enable organizations to detect and resolve performance problems before business operations are affected.

The August 6, 2026 GitHub Actions Outage: Queued Jobs, Throttled Webhooks, Impact Lasting 10 Hours

On August 6, 2026, GitHub opened an incident for degraded Actions performance at 15:22 UTC. Within about twenty minutes, Actions availability was listed as degraded, workflow runs were failing to start or failing partway through, and the Actions REST API was returning errors. Pages was pulled into the same incident shortly afterwards. The status page marked Actions and Pages as mitigated at 00:05 UTC on August 7, and closed the incident at 02:04 UTC.

GPU Cloud security: Isolation, multi-tenancy, and protecting sensitive training data

GPU cloud security tends to get discussed as if it's the same problem as general cloud security. It isn't. GPUs sit between processes in ways CPUs don't. Training data passes through them in patterns that create specific exposure. Model weights derived from sensitive data are themselves sensitive material in ways most procurement processes don't recognize. And the multi-tenant nature of public GPU cloud creates failure modes that don't exist in CPU-only environments.

Inference Optimization Techniques. Ray vs. vLLM vs. KubeRay

Serving large language models at scale is fundamentally a distributed systems problem. A single GPU, or even a single node, is rarely enough once you need multiple models, multiple replicas, tensor-parallel sharding across GPUs, or high-availability rollouts. Kubernetes solves general container orchestration well, but it has no native concept of a GPU-aware, actor-based compute cluster.

AI-Related Outages Are Reshaping On-Call in 2026

AI-related outages just moved from a fringe worry to a mainline reliability problem, and the on-call rotation is where that shift lands first. A new StackGen analysis of nearly 178,000 public status-page records found that incidents disclosed by AI model and AI application companies now account for more than one in ten reported outages, a sixfold jump from 1.7 percent in 2023 to 10.7 percent so far in 2026.

10 Best MySQL Monitoring Tools Compared for 2026

Your monitoring console probably covers the switches, the hosts, the VMs and the application traces. The database tier is the gap. It tends to live in a separate tab. Somebody opens that tab once the incident bridge has already started. That gap got more expensive this year. On 21 April 2026, Oracle moved MySQL 8.0 to Sustaining Support. The version most production estates still run no longer gets new fixes. Good MySQL monitoring tools close the gap.

What Is sFlow? A Guide to Sampled Flow Monitoring

What do you do when the switch carrying most of your traffic is the one device that cannot tell you what is on it? On high-speed core and data centre links, full flow export pushes device CPU past a comfortable line, so the export gets switched off and the busiest segment quietly becomes the least visible one. sFlow was built for that exact situation.