Pocket article: Debugging ccache misses
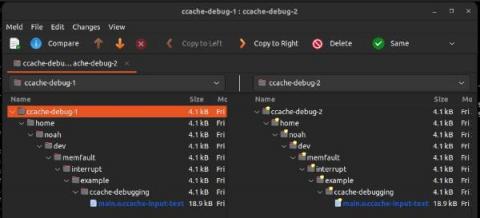
This article provides a few tips and tricks for diagnosing ccache misses, to keep your C/C++ build nice and snappy!


This article provides a few tips and tricks for diagnosing ccache misses, to keep your C/C++ build nice and snappy!
Kubeflow is an open-source MLOps platform that runs on top of Kubernetes. Kubeflow 1.6 was released September 7 2022 with Canonical’s official distribution, Charmed Kubeflow, following shortly after. It came with support for Kubernetes 1.22. However, the MLOps landscape evolves quickly and so does Charmed Kubeflow. As of today, Canonical supports the deployment of Charmed Kubeflow 1.6 on Charmed Kubernetes 1.23 and 1.24.
Every security operations center (SOC) team is different, and for smaller teams, even small challenges can seem big. I started my career in cybersecurity as part of a smaller team, and eventually grew into a SOC role. During that time, I gained a good deal of knowledge about the dos and don’ts of what a small SOC team needs to do in order to be successful.
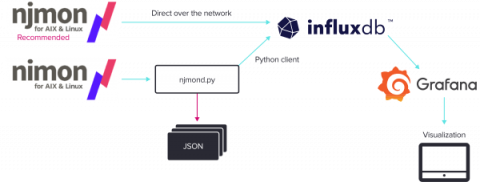
IBM engineer Nigel Griffiths built nmon in the 1990s to monitor operating system performance data for AIX. Since its original launch, Griffiths revisited and revamped nmon. For example, he built an open-source version for Linux. Despite drastic change in the very nature of computing and exponential growth in storage, memory, and compute power, it wasn’t until 2018 that Griffiths sought to completely re-write the tool and bring it into alignment with modern computer systems.
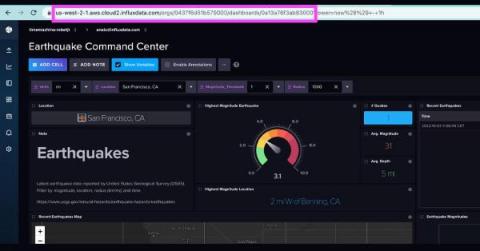
If you’re an InfluxDB and InfluxDB UI user, you’ve almost certainly created dashboards. However, if you’re building dozens of dashboards in the InfluxDB UI, you might have come across the need to deep link related dashboards. In this tutorial we’ll learn how we can use the table view with Flux, string interpolation, and variables to deep link users to other dashboards.
Continuous availability and unceasing innovation are prerequisites for today’s digital businesses. So it makes sense that business leaders invest heavily in teams and tools to monitor digital apps and services. In theory, these tools should also free up time for engineers to push new functionalities that wow customers. But do these investments actually result in more uptime and customer-delighting innovations?
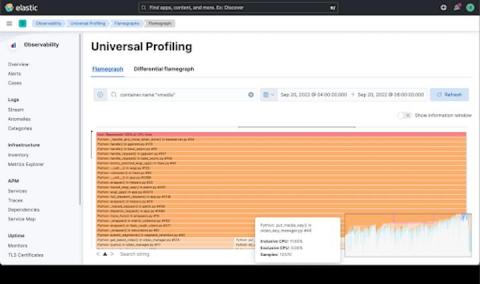
So, what is Universal Profiling™? Universal Profiling™ is fast emerging as an important component of observability. A standard feature inside hyperscalers since approximately 2010, the technology is slowly percolating into the wider industry. Universal Profiling™ allows you to see what your code is doing all the time, in production across a wide range of languages and can profile both user-space and kernel-space code.
Elastic continues to help everyone find what they need faster with Elastic Enterprise Search, a comprehensive solution for building search-powered applications. Elastic Enterprise Search elevates relevance and precision at scale with a new combination of traditional and machine learning-assisted techniques.
The United States is the #1 target for cybersecurity attacks in the world. 38% of targeted cybersecurity attacks so far in 2022 were aimed at the United States data and systems. That’s alarming. And we see it in the news almost every day. Solarwinds, Colonial Pipeline, The Pulse Secure VPN zero-day… There’s an increasing number of threats and attacks, to the tune of 15.1% year over year.