Operations | Monitoring | ITSM | DevOps | Cloud

Latest News

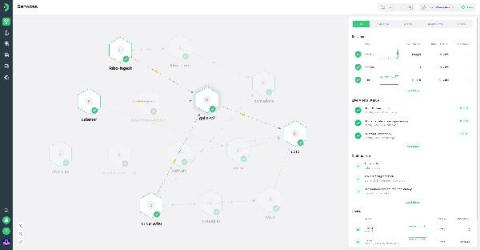
Announcing the All-new Kamon APM Service Map

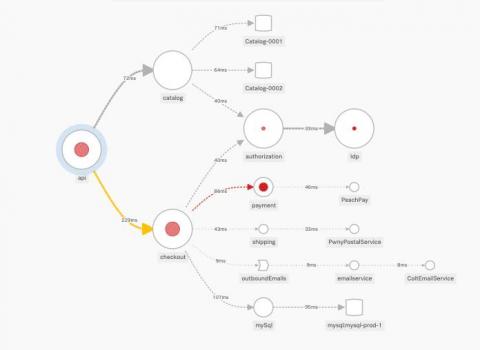
Kamon APM wakes up today with a new home page for all your observability data: the all-new Kamon APM Service Map! The Service Map shows a real-time representation of all your microservices and the dependencies between them, combined with health status and easy access to the most important bits of data from your entire infrastructure.

Application-Centric and Database-Centric Monitoring: Why You Need Both

How would you like it if your application shut down or started running slow without any warning? Let’s say, for instance, users who like your application try to access it, but aren’t able to. How would you know whether low traffic to your site is because users weren’t satisfied or because they simply weren’t able to access it? Users definitely won’t be satisfied when your application starts crawling with long response times.

Improve Business KPIs with Splunk APM Business Workflows

One of the biggest challenges that DevOps teams face is how to connect their efforts with the priorities of business leaders. In conversations we’ve had, developers and SREs discussed how they need to show business and engineering leaders that they are investing their time solving the right problems, and how solving these problems lead to overall better business outcomes.

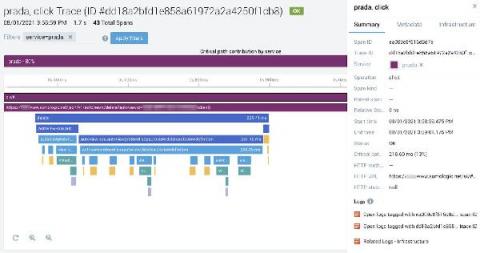
Sumo Logic extends its APM to browser

Over a year ago we decided to invest heavily in Application Observability, understanding the modern observability platform must unite logs, metrics, and traces in one analytics layer to better serve reliability use cases. We have also advocated a modern trend to acquire tracing data via open source industry standards like OpenTelemetry without vendor lock-in.
Sponsored Post

Gain more visibility into code performance with Raygun APM for Node.js

Raygun has been busy building our best-in-class APM so you can provide flawless digital customer experiences. By adding Raygun Application Performance Monitoring to your monitoring suite, your team will gain more visibility on code and server performance, achieve a faster time to resolution with finer granularity, and reduce infrastructure costs by optimizing existing services. Raygun is a developer-friendly product that surfaces more diagnostic details than other APM solutions. Combined with our usage-based pricing, we have the ability to provide companies like Olo with millions of customers with cost-efficient and powerful APM.

Monitoring PHP Application Performance: A Step-by-Step Guide

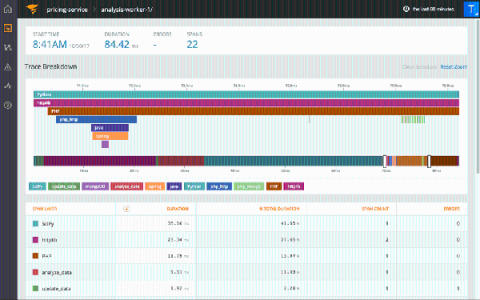
Today we’re here to show you the ropes on PHP monitoring. You’ll learn how to monitor the performance of your PHP applications. But why is doing this valuable in the first place? It used to be common for application performance to be considered a non-functional requirement. Things have changed, though. Nowadays, more and more software professionals have come to think of performance not as a nice-to-have, but as the most important must-have.

Expert Guide to Redis Monitoring

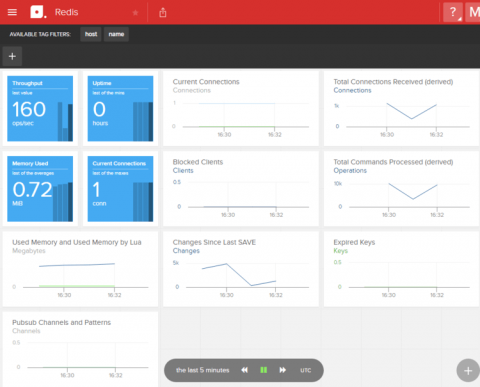
Redis is an open source. in-memory data structure store with blazing performance that’s used as a database, cache, and message broker. Redis is licensed under BSD (Berkeley Source Distribution), which means it can be used for free with some minimum use restrictions. It supports a good number of abstract data structures, such as strings, maps, lists, and so on. Redis, which is used as a database to store data, is fast in performance.

Monitoring Node.js Application With AppOptics on DigitalOcean - Better Together

Many teams take advantage of the convenience of deploying their apps to the platform as a service (PaaS) providers such as DigitalOcean. Cloud solutions like this are an easy way for teams to deploy and scale their applications without worrying about the details. However, even in these managed environments, poorly written apps can cause issues. If your pages load too slowly, users will likely leave your site and look for another.