Operations | Monitoring | ITSM | DevOps | Cloud

Latest News

Logs UI | An intuitive UI for Log Management

A logs UI is a user interface for displaying log data. Logs are records of events that happen on a computer system, such as messages indicating that a particular operation has been performed or an error has occurred. A logs UI typically allows a user to view and search through log data and may also provide features such as filtering and highlighting to help the user find specific log entries of interest.

What are SysLog formats? How to use them?

Syslog is a standard for message logging that allows devices such as routers, switches, and servers to send event messages to a central log server. The messages sent by these devices are known as syslog messages and include information such as the date, time, device hostname, and message content. Syslog was originally developed as a part of the BSD operating system, but many other operating systems and network devices have since adopted it.

2022 Year in Review

If you are like me, I always look forward to reading (here writing) a company's Year in Review and this year is no different. However, as I reflect back on 2022, I realized we achieved a five year anniversary. An anniversary of completing a very big vision of transforming customer’s cloud object storage such as AWS S3 into the first stream-based Search+SQL Analytic Database. Initially providing access via the Elastic (Search) API, then Presto (SQL), at scale and in production.

JSON Logs | Best Practices, benefits, and examples

JSON (JavaScript Object Notation) is a lightweight data-interchange format that has gained widespread popularity in recent years due to its simplicity and flexibility. It is easy for humans to read and write and for machines to parse and generate, making it a great choice for transmitting data in web applications. Logs serve multiple purposes for application developers. They are essential to understand what's happening in your application.

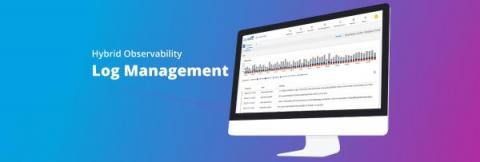
How OpsRamp Log Management Helps You to Find and Fix Issues Faster

OpsRamp has enhanced its hybrid observability capabilities by adding an integrated log management solution to unify log, event and alert data within customers’ monitoring and event management command center. Presenting this log data as part of a unified view of IT performance data and integrating it with remediation capabilities will allow enterprises and service providers to expedite the process of identifying and resolving potential issues before they impact their business operations.

Dos and Don'ts of Observability: Lessons Learned from RedMonk

On November 16, 2022, I sat down with analyst KellyAnn Fitzpatrick from RedMonk to discuss my favorite topic: observability. This time, we looked at observability in a context of what to do and what to avoid doing as you’re starting and going on an observability journey. Click the image below (or here) for a replay of the session. A machine-generated transcript is available at the end of the post.

Optimizing the AWS CloudWatch Log Process

Amazon’s native monitoring and management service AWS CloudWatch is great for basic monitoring and alerts. However, on its own, it may not be the best solution for analyzing log data at scale — especially if you need to analyze data outside of AWS. Many teams may find themselves restricted by retention issues and basic analytic features with Amazon CloudWatch logs for troubleshooting use cases.

SigNoz - Logs Performance Benchmark

Logs are an integral part of any system that helps you get information about the application state and how it handles its operations. The goal of this blog is to compare the commonly used logging solutions, i.e., ElasticSearch(ELK stack) and Loki(PLG stack), with SigNoz on three parameters: ingestion, query, and storage. Performance benchmarks are not easy to execute. Each tool has nuances, and the testing environments must aim to provide a level playing field for all tools.

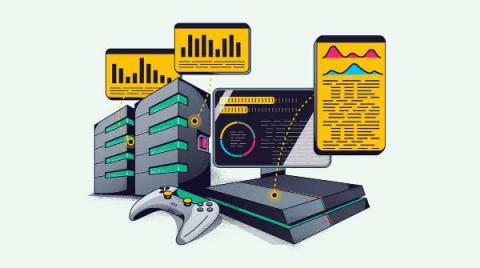
Application Performance Monitoring in the Gaming Industry

The gaming industry delivers specialized software at scale to users who expect a flawless interface. Application performance monitoring (APM) will measure critical software performance parameters using telemetry data. By monitoring this data, teams can ensure their game delivers the best user experience and quickly detect when the software needs updates to fix errors or meet key performance indicators (KPIs).

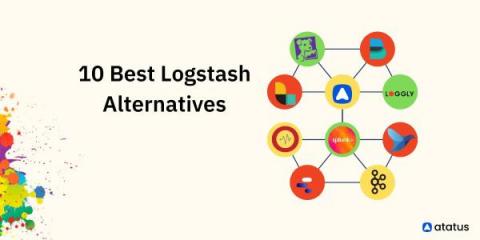
Logstash Alternatives in 2023: 10 Best Options

Data processing involves collecting, organizing, and manipulating data in a systematic manner in order to extract useful information from it. It involves a series of steps that are performed on a set of data to transform it into a more meaningful and functional form for a specific purpose. Starting from collecting the data to the end part of processing it, data undergoes several layers of checks and balances before it is let out as we see it.