Operations | Monitoring | ITSM | DevOps | Cloud

Latest News

Application Performance Monitoring in the Gaming Industry

The gaming industry delivers specialized software at scale to users who expect a flawless interface. Application performance monitoring (APM) will measure critical software performance parameters using telemetry data. By monitoring this data, teams can ensure their game delivers the best user experience and quickly detect when the software needs updates to fix errors or meet key performance indicators (KPIs).

Logstash Alternatives in 2023: 10 Best Options

Data processing involves collecting, organizing, and manipulating data in a systematic manner in order to extract useful information from it. It involves a series of steps that are performed on a set of data to transform it into a more meaningful and functional form for a specific purpose. Starting from collecting the data to the end part of processing it, data undergoes several layers of checks and balances before it is let out as we see it.

Top 10 Logging Frameworks Across Various Programming Platforms

A logging framework is a software tool that helps developers output diagnostic information during the execution of a program. This information is used to debug the program or monitor its performance. There are many different logging frameworks available, starting with simple logging libraries to full-fledged logging and observability platforms.

11 unique insights into SLOs and reliability management

A quarter has passed since we launched our Reliability Management capabilities that help developers focus on defining, monitoring and managing Service Level Objectives (SLOs) to drive great digital experiences. Reducing alert fatigue and balancing innovation with reliability are common outcomes that customers expect from Reliability Management. If you are new to SLOs, these insights from our customers capture common practices among peer developers.

Grafana Agent v0.30: Flow adds support for logging pipelines and graduates to beta

Grafana Agent v0.30 is here! The past couple of Grafana Agent releases have been pretty exciting for us. We introduced Agent Flow as a new way to configure, run, and debug telemetry pipelines. We also announced OpenTelemetry Collector components to expand on our Big Tent philosophy and allow users to switch seamlessly between the Prometheus and OTel ecosystems. This latest release continues that momentum by introducing Loki components for building logging pipelines and marking Flow mode as beta!

Log monitoring and unstructured log data, moving beyond tail -f

Log files and system logs have been a treasure trove of information for administrators and developers for decades. But with more moving parts and ever more options on where to run modern cloud applications, keeping an eye on logs and troubleshooting problems have become increasingly difficult.

Tis the Season: 3D Observability for Prometheus + Grafana + Octoprint

You may get lucky this holiday season with a new 3D printer, either as a gift or something you give yourself as a reward for all your hard work this year. Household 3D printers have made tremendous strides in ease of use and affordability over the last decade.

The only Helm chart you need for Grafana Loki is here

The community has spoken, six Helm charts is not enough! We agree! In all seriousness though, six charts is simply too many to maintain. And while it might sound counterintuitive, that’s why we are announcing a new Helm chart. By focusing on the “Grafana Labs way" to run Grafana Loki using Helm, we believe this will help us and the community concentrate our Helm efforts into a single chart. This new chart is released under grafana/loki at Helm version 3 or higher.

Modern observability and security on Kubernetes with Elastic and OpenTelemetry

The structured nature of Kubernetes enables a repeatable and scalable means of deploying and managing services and applications. This has led to widespread adoption across market verticals for both on-premises and cloud deployment models. The autonomous nature of Kubernetes operation, however, demands comprehensive, fully-converged observability and security. This is uniquely possible today using the Elastic platform.

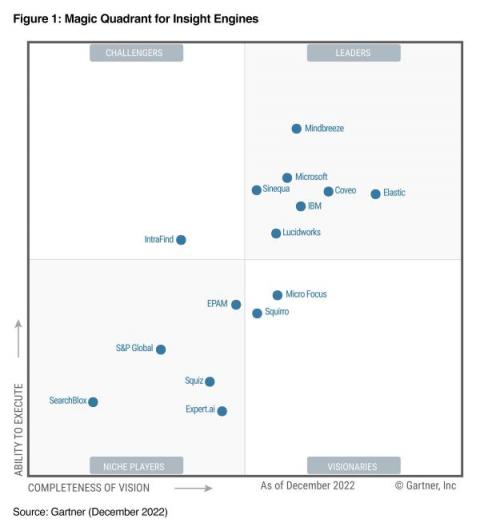
Elastic recognized as a Leader in the 2022 Gartner Magic Quadrant for Insight Engines

We’re pleased to announce that Elastic has been named a Leader in the 2022 Gartner® Magic Quadrant™ for Insight Engines. This is our second year of inclusion in the Gartner Magic Quadrant for this category, and this year’s evaluation places Elastic as the furthest entry on the "Completeness of Vision" axis.