Operations | Monitoring | ITSM | DevOps | Cloud
Latest News
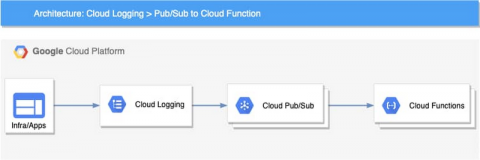
Detecting and responding to Cloud Logging events in real-time
Logging is a critical component of your cloud infrastructure and provides valuable insight into the performance of your systems and applications. On Google Cloud, Cloud Logging is a service that allows you to store, search, monitor, and alert on log data and events from your Google Cloud Platform (GCP) infrastructure services and your applications. You can view and analyze log data in real time via Logs Viewer, command line or Cloud SDK.
Automating Security on Your Observability Platform: Cortex XSOAR & Logz.io
Managing a complex microservice-based architecture requires defending multiple endpoints. Automating security covers a vast amount of tools and methodologies, so making sure they all communicate is critical. Additionally, tool sprawl in any aspect of DevOps requires putting automation to good use. The Logz.io Cloud SIEM focuses on identifying threats. To optimize its effectiveness, we have negotiated and built out multiple integrations tying complementary tools together.
Why does Elastic Support keeping asking for diagnostic files?
If you’ve worked with Elastic Support, you may have been asked to run the Support Diagnostic tool and provide the output in your support case. This is a common practice, but a lot of you out there may not know why. While the short answer is "it depends", this blog is going to explain why we keep asking for diagnostic files (as well as what’s in them). Simply put, the Support Diagnostic helps Elastic Support understand the state of your cluster.
Kubernetes observability tutorial: Log monitoring and analysis
Kubernetes has emerged the de facto container orchestration technology, and an integral technology in the cloud native movement. Cloud native brings speed, elasticity, and agility to software development, but also increases the complexity — with hundreds of microservices on thousands (or millions) of containers, running in ephemeral and disposable pods. Monitoring such a complex, distributed, transient system is challenging, and at the same time very critical.
Kubernetes observability tutorial: K8s cluster setup and demo app deployment
The easiest way to get the Elastic Stack up and running for this tutorial, is to spin up a 14-day free trial of our Elasticsearch Service on Elastic Cloud. A few clicks (no credit cards) and you’ll have your cluster up and running. Or if you prefer, download the Elastic Stack and install locally. All of the instructions in this tutorial can be easily amended to work with a standalone Elasticsearch cluster on your own hardware.
Splunk Ranked #1 in Market Share for IDC's Worldwide IT Operations Management Software Market Shares, 2019
We’re excited to announce that Splunk has been named the leader for both market revenue and market share in IDC’s Worldwide IT Operations Management Software Market Shares, 2019 report, having captured 13% of the overall ITOM market and achieving 32.3% year-over-year growth*. We believe this recognition speaks to the continued success of our customers, and we are so thankful for the opportunity to be a part of that success.
Splunk Remote Work Insights: Expanding Insights into Video Conferencing Operations
Since we launched Splunk Remote Work Insights (RWI) in late March, we have been focused on helping our customers and the community understand how their workforce is staying connected, productive and engaged as we all continue to work across largely distributed teams.
Simulating the Entire US Pharmaceutical Supply Chain with Full-Stack Analytics
With the rising needs associated with COVID-19, the challenges of the commercial drug supply chain is more evident than ever. This article features an innovative and progressive technology that uses blockchain to solve the ongoing problem with the drug distribution chain.
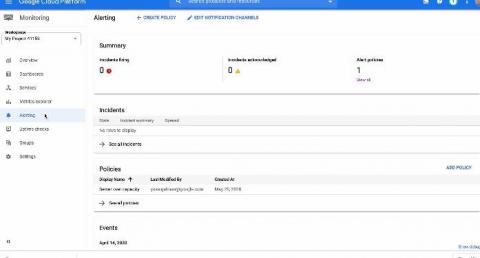
Introducing Pub/Sub as a new notification channel in Cloud Monitoring
Around the world, operations teams are working to automate their monitoring and alerting workflows, looking to reduce the time they spend on rote operational work (what we call “toil”), so they can spend more time on valuable work. For instance, Google’s Site Reliability Engineering organization aims to keep toil below 50% of an SRE’s time, freeing them up to work on more impactful engineering projects.


