Operations | Monitoring | ITSM | DevOps | Cloud

Latest News

Using Recommenders to keep your cloud running optimally

As a cloud project owner, you want your environment to run smoothly and efficiently. At Google Cloud, one of the ways we help you do that is through a family of tools we call Recommenders, which leverage analytics and machine learning to automatically detect issues and present you with optimizations that you can act on.

How a regex simplification in Loki increased performance by up to 300x

When we graduated Loki into a GA release last year, there were more than 137 contributors who already made more than 1,000 contributions to the project. We also added hosted Loki to the lineup of Grafana Cloud offerings after it proved to be stable internally for our ops cluster, storing 40TB and half a trillion log lines each month. There was, however, one persistent problem that kept surfacing, especially for developers who were writing applications in Go: The regex package was slow.

Jaeger Essentials: Performance Blitz with Jaeger

I’d like to share some of the best practices we’ve learned on our journey to battle performance issues with the Jaeger tracing tool. Some may say we are experts in logging. We log for a living, and have our log analytics service (which we based on open source ELK Stack) to prove it. We’ve mastered logging to the level where debugging and troubleshooting our system is a no-brainer.

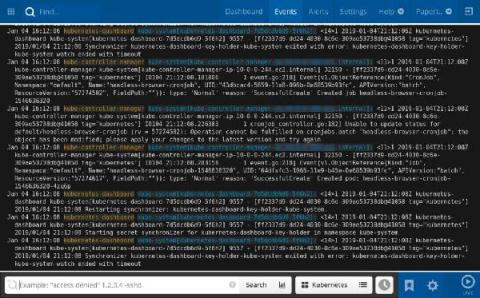
5 Best Tools to Tail Logs in 2020

Modern businesses rely on a complex ecosystem of digital networks, databases, applications, user devices, and more. The tools and platforms supporting this ecosystem undergo constant refinement and upgrades. However, the basic methods for monitoring infrastructure and application performance have remained unchanged, and logging is one such methods. Every computer, server, networking device, and application produces logs, a timestamped record of events within a system.

5 Best Tools to Tail Logs

Modern businesses rely on a complex ecosystem of digital networks, databases, applications, user devices, and more. The tools and platforms supporting this ecosystem undergo constant refinement and upgrades. However, the basic methods for monitoring infrastructure and application performance have remained unchanged, and logging is one such methods. Every computer, server, networking device, and application produces logs, a timestamped record of events within a system.

Real-time monitoring of Fastly metrics with the Elastic Stack and Haskell

The Stack Infra team at Elastic uses many services to provide downloads for projects like Elasticsearch and Kibana to our users. One of these services is Fastly, which helps us optimize delivery to regions around the world. Keeping an eye on the performance and behavior of our CDN is important to ensure we're operating at the level we expect.

MySQL Log File Location

Logs are valuable. Logs generated by a major backend resource that provides clients with access to crucial data are more than just valuable; knowing where they are and being able to manage and understand the information that they contain can mean the difference between smooth, secure operation and degraded performance or even catastrophic failure for your application. MySQL Server produces a handful of basic logs.

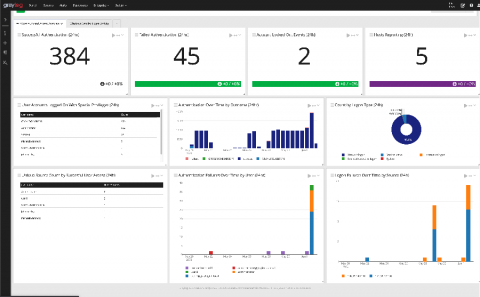
Announcing Graylog Illuminate for Authentication

Graylog Illuminate for authentication is a brand new offering designed by our Enterprise Intelligence team. It eliminates the manual setup necessary to detect, monitor, and analyze authentication activities and issues across your IT infrastructure by providing pre-built Dashboards, Alerts, and data enrichment. Initially, Graylog Illuminate for Authentication will address Windows authentication issues and activities. We will release additional data sources in the coming weeks so stay tuned!

The First OpenObservability Conference is a Wrap

Last week, the first OpenObservability conference took place. This event had amazing content contributions from open source project leaders, users, and influencers. We’ve seen massive growth and adoption in the open source observability space from the inspiring work being done across tracing, logging, and especially metrics. The new data stores and capabilities are growing at breakneck speed. There are more choices— yet more complexity—than ever before.