Operations | Monitoring | ITSM | DevOps | Cloud

Latest News

Loki's Path to GA: Query Optimization, Part Three

Launched at KubeCon North America last December, Loki is a Prometheus-inspired service that optimizes storage, search, and aggregation while making logs easy to explore natively in Grafana. Loki is designed to work easily both as microservices and as monoliths, and correlates logs and metrics to save users money. Less than a year later, Loki has almost 6,500 stars on GitHub and is now quickly approaching GA.

Know Your Logs: IIS vs. Apache vs. NGINX Logs

Today’s web server ecosystem has three big players: IIS, Apache and NGINX. Although only two of them (Apache and, to a lesser extent, NGINX) are cross-platform, it’s increasingly important to be able to work with all three of these servers, because you never know which type of operating system and web server platform you’ll be asked to support. That’s why understanding the nuances of IIS, Apache and NGINX logs is important.

Get a Free LogDNA Account in The Github Student Developer Pack

As a student, developing your software engineering skills is about continuous learning and practice. When building software in the real-world, developers are expected to be proficient with a variety of tools and stacks. Internships, class and personal projects provide great opportunities for students to gain the experience needed to become more effective.

NGINX LOGS - Full Guide 2020: Monitoring, Analyzing and Troubleshooting Your NGINX Logs

Life is about making choices: Coke or Pepsi? Beatles or Stones? Mac or PC? In the world of web servers, the choice used to be between open-source Apache and Microsoft’s IIS. Back in 2004, when everybody had lost interest in the World Wide Web, an upstart web server appeared out of nowhere. Now, just over fifteen years later, NGINX has been rapidly rising in popularity and currently has a 30.8% of the webserver market compared to Apache’s 44.1%.

Loki's Path to GA: Query Optimization, Part Two

Launched at KubeCon North America last December, Loki is a Prometheus-inspired service that optimizes storage, search, and aggregation while making logs easy to explore natively in Grafana. Loki is designed to work easily both as microservices and as monoliths, and correlates logs and metrics to save users money.

Nginx Web Server Monitoring with the ELK Stack and Logz.io

Nginx is an extremely popular open-source web server serving millions of applications around the world. Second only to Apache, Nginx’s owes its popularity as a web server (it can also serve as a reverse proxy, HTTP cache and load balancer) to the way it efficiently serves static content and overall performance.

A complete Logstash pipeline for your Icinga logs

When we hunt down problems in Icinga setups we ask for logs most of the time. While you get used to sifting through logs and collect some bash magic during the process there’s always the wish for this routine to be easier and especially faster. If you get logfiles from several days where each of the nodes produces millions of logfiles per day, every time you start your grep’s over and over get’s you madder and madder. So I started searching for a solution.

Announcing Graylog 3.1

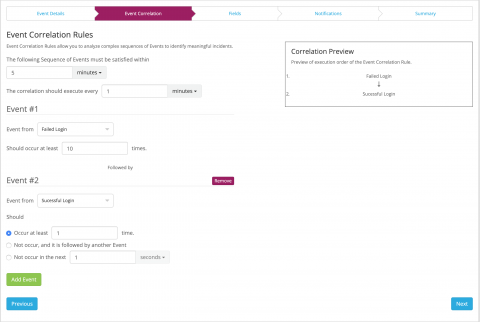
Announcing Graylog v3.1 Today we are officially releasing Graylog v3.1. This release brings a whole new alerting and event system that provides more flexible alert conditions and event correlation based on the new search APIs that also power the views. In addition, some extended search capabilities introduced in Graylog Enterprise v3.0 are now available in the open source edition in preparation for unifying the various search features.

Loki's Path to GA: Query Optimization, Part One

Launched at KubeCon North America last December, Loki is a Prometheus-inspired service that optimizes storage, search, and aggregation while making logs easy to explore natively in Grafana. Loki is designed to work easily both as microservices and as monoliths, and correlates logs and metrics to save users money. Less than a year later, Loki has almost 6,500 stars on GitHub and is now quickly approaching GA.

Introducing On-Demand Logging with Logz.io Drop Filters

Logs need to be stored. In some cases, for a long period of time. Whether you’re using your own infrastructure or a cloud-based solution, this means that at some stage you’ll be getting a worried email from your CFO or CPO asking you to take a close look at your logging architecture. This, in turn, will push you to limit some data pipelines and maybe even totally shut off others. Maybe we don’t need those debug logs after all, right? Wrong.