Operations | Monitoring | ITSM | DevOps | Cloud

Latest News

Observability Trends in 2020 and Beyond: Announcing the DevOps Pulse 2019 Results

2020 is here and it looks like it’ll be a truly exciting and impactful year for the DevOps community. As you know, the landscape is changing rapidly, and as a result, new technologies and methodologies are emerging to solve challenges you’re experiencing on the job. Observability is one such concept–and achieving it is a huge challenge for software engineers across the globe.

Understanding the Apache Access Log: View, Locate and Analyze

As any developer or system administrator will tell you, log files are an extremely useful tool for debugging issues within a web application. In fact, log files are typically utilized as the primary source of information when a website is malfunctioning. One specific log file that can be used in debugging applications (or simply gaining insight into visitor activity) is the access log produced by an Apache HTTP server.

Splunk Stream 7.2 - Integration with Amazon VPC Traffic Mirroring

Recently, our good friends at Amazon Web Services (AWS) launched an awesome new product, VPC Traffic Mirroring. Here at Splunk, we are excited about this new capability as it allows our Splunk Stream platform to ingest this data, and send it on to any Splunk instance, in the cloud or on premises. Leveraging this capability allows Splunk users to collect specific network data from their AWS environment, and use it to fulfill security, IT Ops, or business-focused use cases.

A Quick Start on Java Garbage Collection: What it is, and How it works

In this tutorial, we will talk about how different Java Garbage Collectors work and what you can expect from them. This will give us the necessary background to start tuning the garbage collection algorithm of your choice. Before going into Java Garbage Collection tuning we need to understand two things. First of all, how garbage collection works in theory and how it works in the system we are going to tune.

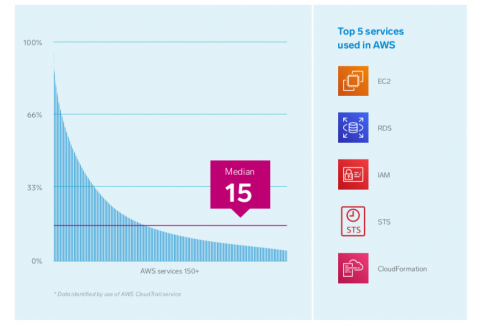
AWS offers 175 services now. Should you be adopting many of them now?

At this year’s AWS reInvent, we heard Andy Jassy go on stage to announce a bunch of new services to help companies unleash the power of cloud. 27 new services to be exact - everything from Machine learning IDE, to code review tools to contact center offerings (see the full list here); last year, AWS announced another 30 new services ranging from machine learning to VR/AR to satellite data. So now AWS has over 175 services - a staggering count by any imagination.

Logging Redis with ELK and Logz.io

Redis is an extremely fast NoSQL data store. While it is used mainly as a cache, it can be applied to uses as diverse as graph representation and search. Client libraries are available in all of the major programming languages, and it is provided as a managed service by all of the top cloud service providers. For the past three years, Redis has been named the most loved database by the Stack Overflow Developer Survey.

Can You Tell Debug Data and BI Data Apart?

A few blogs posts ago I wrote about new BI for digital companies and in that blog I alluded that quite a bit of that BI is based on log data. I wanted to follow up on the topic of logs, why they exist and why they contain so much data that is relevant to BI. As I said in that post, logs are an artifact of software development and they are not premeditated, they are generated by developers almost exclusively for the purpose of debugging pre-production code. So how is it that logs are so valuable for BI?

A tour of Go concurrency patterns via the new Heartbeat scheduler

Curious about how to write more idiomatic concurrent code in Go? It’s not always easy or intuitive, even if you’ve done lots of concurrent programming in other languages. I’ve been lucky to have worked in a well-written code base, and had the expert advice of Beats core area lead Steffen Siering along the way. In this post I’ll walk you through how we implemented a new scheduler for Heartbeat that is part of our upcoming 7.6.0 release.

How KeyBank used the Elastic Stack to build an enterprise monitoring solution

KeyBank is one of the largest banks in the United States. And as the bank has grown, so has their end-to-end monitoring system. With more than 1,100 branches and 1,400 ATMs stretching across 15 states, KeyBank’s infrastructure had evolved into a “Noah’s Ark of design,” says Mick Miller, Senior Product Manager, Cloud Native at KeyBank. In other words, they had two of everything, resulting in 21 different data islands.