Operations | Monitoring | ITSM | DevOps | Cloud

Latest News

Enhancing AWS security with Graylog centralized logging

AWS is a popular destination for IaaS that offers quickly saleable resources to meet even the largest customer demands. Cloud scalability like this can generate a large amount of logs you need to monitor to keep up with your cybersecurity goals. Getting those logs into a SIEM or centralized log management platform such as Graylog is key to have proactive monitoring and alerting.

What Is Log Collection? The Value of Unifying Your Logging

If you work in IT, especially on the decision-making side, then you should be aware of how vital logging is. When things go wrong with software in production, a solid logging approach often is the difference between hours of fruitless troubleshooting and an easy fix. Today, we’re here to talk about logging by covering a specific angle. Namely, we’ll answer the question, “What is log collection?”

Elastic Advent Calendar, 2019: the full recap!

Wow, it's finally here! After 25 fantastic articles we've reached the end of the 2019 Elastic Advent series. We've covered Elasticsearch and Python, Auditbeat, ECS, data transform, jvm options, anomaly detector models, Maps, SSL configuration, Smart query cancellation, data transforms, SLM, the new enrich processor, App Search, and so much more. In the topics we've spoken in German, Greek, English, French, Finish, Spanish and Swedish.

Prometheus and Grafana: A Match Made in Heaven?

Prometheus and Grafana are two monitoring tools that, when combined, provide all of the information DevOps and Dev teams need to build and maintain applications. Prometheus collects many types of metrics from almost every variety of service written in any development language, and Grafana effectively queries, visualizes, and processes these metrics.

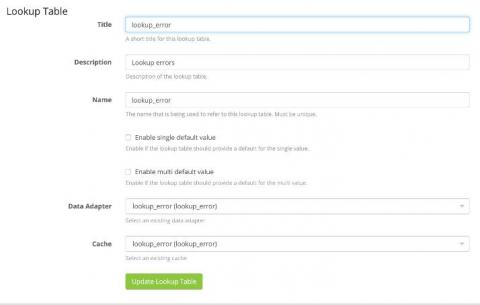
How to Use Graylog Lookup Tables

Logs are a wealth of information containing meta-data from IP addresses, User Names, and error codes. While this is all extremely helpful, the task of understanding all this can seem overwhelming at times to an untrained eye. Other times, corporations might have additional resources they would like to enrich their logs with, i.e., adding a department name to a log message that depends on the username in the log.

What Is Operational Analytics? A Practical Introductory Guide

Cloud computing, mobile devices, and IoT technologies continue to evolve and proliferate. As a result, businesses are generating and collecting more data than ever before. Data is generated and stored every time a customer interacts with a website or device. Savvy companies understand the importance of capitalizing on that data. It enables them to enhance customer experiences and increase profitability, among other countless benefits.

Using Logz.io for Spring Boot Logs

We recently wrote a blog with Julien Dubois, a Java Developer Advocate from Microsoft, on how to simplify logging for Spring Boot applications. This is a small preview. Spring Boot is an open source Java framework that makes it easier for developers to create microservices. Azure just announced Azure Spring Cloud, which will help Java engineers on Azure developer Java microservices faster. This blog explores how to simplify logging for Spring Boot applications.

Guide: RegEx 101 for Managing Log Data

Regular expressions can be crucial for wrangling log data efficiently. You may want to extract specific data from your logs to make it easier to analyze and visualize. Sometimes you might want to capture an email when a particular message is logged. Other times, you may find yourself needing to hide sensitive data in logs before they are saved. And more often than not, you need to match using a RegEx pattern rather than an exact text search. This guide is split into three parts.

SolarWinds Papertrail Event Viewer Upgrade

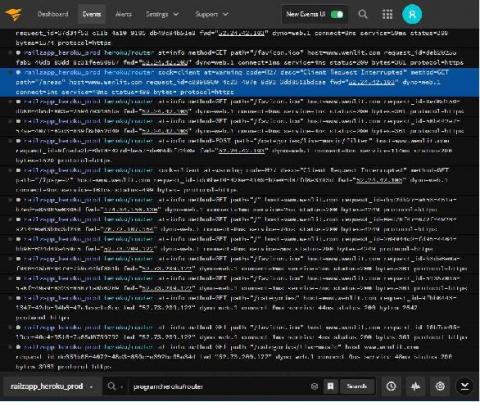
If you’ve visited the SolarWinds® Papertrail™ event viewer this week, you may have noticed it’s roomier. There’s less scrolling needed and more of the log line appears on the screen. You may be wondering what changed. Based on suggestions from user feedback, we streamlined the navigation and tucked it into the top bar. This change lets the logs message fill the entire screen width and lets you see more of the log message, with less scrolling.