Elastic Stack Features (formerly X-Pack) is an Elastic Stack extension that bundles security, alerting, monitoring, reporting, and graph capabilities. One could use either all or specific components. People love Splunk. But not its price. So people are always on a lookout for a good Splunk alternative. Many of those people migrated from Splunk to ELK Stack or Hosted ELK Stack solutions like Logsene.
Today, I am proud to announce the release of Logz.io Infrastructure Monitoring, a Grafana-based monitoring solution that enables engineers to speed up detection and reduce time to resolution. This new offering extends our Log Management and Cloud Security (Cloud SIEM) products, which together form Logz.io’s new Cloud Observability Platform.
We are pleased to announce the general availability of external collection for Elastic Stack Monitoring. With this announcement comes the ability to monitor Elasticsearch, Kibana, Logstash, APM server, and Beats all via Metricbeat modules. Using external collection, users now have the capability to collect and send monitoring data for their Elastic Stack without having to depend on the health of the monitored services.
We are excited to announce the beta release of Sumo Logic’s Archive Intelligence Service, which enables customers to forward logs directly from Sumo Logic’s installed collector to their own, self-managed AWS S3 buckets. This service gives users the ability to reliably gather and economically store log data which may not be needed for immediate analysis or operations, but is still important to keep for later use.
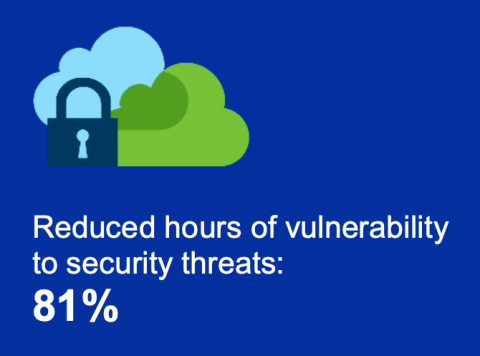
Security is a top concern for any enterprise to move their applications and workloads to the public cloud. AWS offers a broad selection of native security tools and as our Continuous Intelligence Report noted, AWS customers are using several of these to improve the security of their AWS environment. However, it can be overwhelming to know where to start and how to deploy best practices for detecting security misconfigurations caused by human errors and attacks from external sources.
AWS offers more than 150 discrete services, spanning compute, storage, database, network, and identity management to name a few. Earlier this year we published our Continuous Intelligence Report in which we surveyed Sumo Logic customers on how broadly they used the various AWS services. We found that the median number of different services most orgs use was 15.
We’ve already covered why log management is important, but we’ve only briefly touched upon one of the best ways that managing your log files can help you and your enterprise, which is, namely – with troubleshooting.
Time for another installment in the series where we explain in detail yet another important metric for tech organizations. After covering MTTD and MTTF, today we answer the question, “What is MTBF?” As the post title makes clear, MTBF stands for “Mean time between failures.” The acronym refers—like the others that came before it—to an important DevOps KPI. But what actually is it? What is it good for? How do I implement it?
We are happy to inform you that we are upgrading our user interface to support Kibana 7 for Logz.io! Kibana 7 offers users a long list of UI and UX enhancements that will make monitoring and troubleshooting your environment a much simpler and nicer experience. These enhancements include a cross-app dark theme, a new time picker, new filtering, a better dashboarding experience, and most importantly – a significant boost in performance. Shall we take a closer look?