How to display data as a percentage in Kibana visualizations
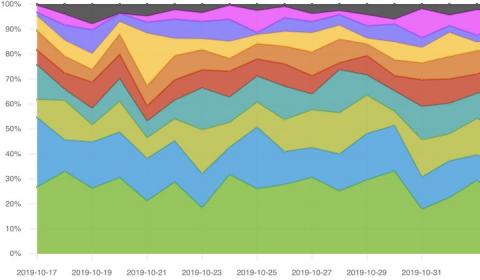
Using percentages when performing data analytics is an essential approach to effective numeric comparison, especially when the data in question demonstrates drastically different sample sizes or totals. Percentages allow for a quick and accurate understanding of how much data sums have changed across a dimensional category like a range of time, geographic regions, product lines, etc.


