Operations | Monitoring | ITSM | DevOps | Cloud

Latest News

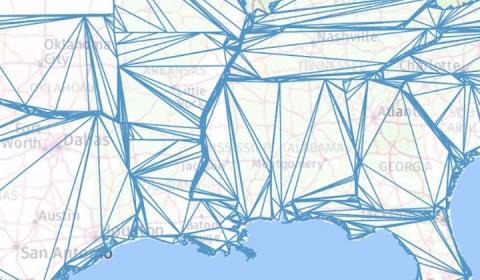
BKD-backed geo_shapes in Elasticsearch: precision + efficiency + speed

With the addition of new data structures in Lucene 6.0, the Elasticsearch 5.0 release delivered massive indexing and search performance improvements for one-dimension numeric, date, and IP fields, and two-dimension (lat, lon) geo_point fields. Building on this work, the Elasticsearch 6.0 release further improved usability and simplicity of the geo_point API by setting the default indexing structure to the new block k-d tree (BKD) and removing all support for legacy prefix tree encoding.

Understanding Java Garbage Collection Logging: What Are GC Logs and How To Analyze Them

When working with Java or any other JVM-based programming language we get certain functionalities for free. One of those functionalities is clearing the memory. If you’ve ever used languages like C/C++ you probably remember functions like malloc, calloc, realloc and free. We needed to take care of the assignment of each byte in memory and take care of releasing the assigned memory when it was no longer needed.

Image recognition and search at Adobe with Elasticsearch and Sensei

Software giant Adobe is known the world around for its Photoshop, Illustrator, and Acrobat products, which are rolled into cloud service suites — Creative Cloud, Document Cloud, and Experience Cloud — of other similar software offerings. A number of their products — especially those where image search is critical, such as Adobe Stock — feature slick search capabilities that use Elasticsearch behind the scenes.

All The Logs For All The Intelligence

If you are reading this, I don’t have to convince you any further of the powerful intelligence we can derive from logs and machine data. If you are anything like the many, many users, customers and prospects we have been talking to over the years, you might, however, have some level of that pesky modern condition commonly known as volume anxiety. The volume here, of course, is the volume of data––there is a lot of it, and it keeps growing.

Ingesting Cloudtrail Logs with the Graylog AWS Plugin

Cloudtrail logs provide excellent insight into how your AWS account is being used. They record all activity by the web console, SDKs, and APIs. With help from the AWS plugin, getting this information into Graylog is easier than ever. In this blog post you'll set up the required AWS resources, configure the Graylog input, and do some basic searches to explore its capabilities.

Running and Deploying Elasticsearch on Kubernetes

Big data, AI, machine learning, and numerous others are all buzzwords we seem to throw around lightly in recent years. Even though they are hugely different from one another, they all have one thing in common. Data! Huge amounts of data that need to be managed. The downside of that is that the more data you have the more of a headache it is to store, query, and make sense of.

How to Do Automatic Annotations with Grafana and Loki

Grafana annotations are great! They clearly mark the occurrence of an event to help operators and devs correlate events with metrics. You may not be aware of this, but Grafana can automatically annotate graphs by querying Loki. Here’s a look at how to use this feature. Loki queries can be used to automatically generate annotations on Grafana dashboards since 6.4.0. For every log line that is returned from a query, the text is automatically displayed as an annotation at the appropriate time.