Operations | Monitoring | ITSM | DevOps | Cloud

Latest News

Improving Kubernetes Clusters' Efficiency with Log Management

Log management plays an important role in helping to debug Kubernetes clusters, improve their efficiency, and monitor them for any suspicious activity. Kubernetes is an open-source cluster management software designed for the deployment, scaling, and operations of containerized applications.

How Loki Reduces Log Storage

Several months ago, Bryan Boreham introduced a few changes to Cortex that massively reduced its storage requirements. The changes were quite simple and altogether had a nice benefit of using almost 3x less data storage than prior versions. Since Loki shares a lot of code with Cortex, could we use these ideas to the same effect? (Spoiler alert: Yes, we can!)

5 Surefire Ways to Improve Your Product Reliability with Logging and Automation

In the fast-moving world of software development, as your product and organization grow and evolve, there are almost always competing priorities. Zeroing in on what is most important to your business in order to take it to the next level can at times seem like a non-stop process of trial and error. Oftentimes the customer who screams the loudest becomes a priority and gets the most focus.

Tutorial: Shipping AWS Kinesis Data Stream Logs to Logz.io

Kinesis is a managed, high-performance and large-capacity service for real time processing of (live) streaming data. Prominent users include Netflix, Comcast and Major League Baseball. Its design to let it grab data from multiple sources at the same time and to scale processing within EC2 instances.

Mac system extensions for threat detection: Part 3

This is the third and final post of a three-part series on understanding kernel extension frameworks for Mac systems. In part 1, we reviewed the existing kernel extension frameworks and the information that these frameworks can provide. In part 2 we covered techniques that could be used in kernel to gather even more details on system events. In this post, we will go into the new EndpointSecurity and SystemExtensions frameworks.

Introducing the Splunk for CMMC Solution

On January 31st, 2020, the Office of the Undersecretary of Defense for Acquisition and Sustainment (OUSD A&S) published V1.0 of the Cybersecurity Maturity Model Certification (CMMC). The CMMC builds on DFARS both in terms of required practices and by establishing “trust, but verify” relationships with DoD contractors.

Everything You Need to Know About the Splunk Plugin for Grafana

Last week on Slack: Eldin: Hey Christine, do you remember the first time you viewed a log file? Christine: Oh yes. I used Splunk as a support engineer and I remember. You? Eldin: I believe it was early 2000s. I was installing Slackware and a few network cards for a DIY router, and logs were critical. Hello again! We are Eldin and Christine from Solutions Engineering – a team at Grafana that is passionate about connecting people to our products – reporting back for duty.

Integrating Tracing and Logging with OpenTelemetry and Stackdriver

One of the main benefits of using an all-in-one observability suite like Stackdriver is that it provides all of the capabilities you may need. Specifically, your metrics, traces, and logs are all in one place, and with the GA release of Monitoring in the Cloud Console, that’s more true than ever before. However, for the most part, each of these data elements are still mostly independent, and I wanted to attempt to try to unify two of them — traces and logs.

Introducing the Stackdriver Cloud Monitoring dashboards API

Using dashboards in Stackdriver Cloud Monitoring makes it easy to track critical metrics across time. Dashboards can, for example, provide visualizations to help debug high latency in your application or track key metrics for your applications. Creating dashboards by hand in the Monitoring UI can be a time-consuming process, which may require many iterations. Once dashboards are created, you can save time by using them in multiple Workspaces within your organization.

How Can I Check My ElastAlert Rule is Configured Correctly?

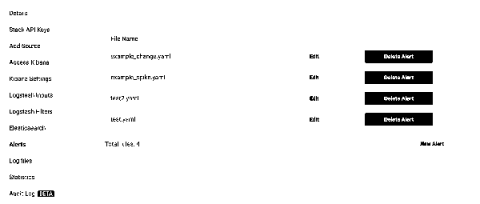
Making sure that your ElastAlert yaml file is formatted and configured correctly. All of the below points will prevent alerts from being fired but there may not be an error message associated with the problem. It is possible you may need to contact support to investigate this issue for you. Make sure to proof read the rule you have written to ensure that it is what you expect to see as most of the issues regarding ElastAlert not working correctly is related to the points above.