Operations | Monitoring | ITSM | DevOps | Cloud

Latest News

A New Approach to the Service Model in the Data Industry

In this livestream, I had a great discussion with Paul Stout and Scott Gray from nth degree about how the service model has evolved from a focus on time and materials to outcome-based services. Watch the full conversation here and leave with a roadmap for improving your next service engagement. Security teams often have a love-hate relationship with onboarding new tools.

The Leading Data Dashboard Examples

As organizations produce a significant amount of data from varying sources, simple analytics tools can make it challenging and time-consuming to derive insights from this data. Data dashboards can assist with this. A data dashboard is a visual representation of data that offers an at-a-glance view of key performance indicators (KPIs), metrics, and other important information relevant to a particular business, organization, or process.

How to Calculate Log Analytics ROI

Calculating log analytics ROI is often complicated. For many teams, this technology can be a cost center. Depending on your platform, the cost of a log management solution can quickly add up. For example, many organizations use solutions like the ELK stack because the initial startup costs are low. Yet, over time, costs can creep up for many reasons, including the volume of data collected and ingested per day, required retention periods, and the associated personnel needed to manage the deployment.

Mastering CloudTrail Logs, Part 1

CloudTrail logs are a type of log generated by Amazon Web Services (AWS) as part of its CloudTrail service. AWS CloudTrail records API calls made within an AWS account, providing a history of activity including actions taken through the AWS Management Console, AWS Command Line Interface (CLI), and AWS SDKs. For example, CloudTrail events are generated for actions such as EC2 instances start/stop, S3 bucket read/write and IAM user creation/deletion.

Enhancing Data Ingestion: OpenTelemetry & Linux CLI Tools Mastery

While OpenTelemetry (OTel) supports a wide variety of data sources and is constantly evolving to add more, there are still many data sources for which no receiver exists. Thankfully, OTel contains receivers that accept raw data over a TCP or UDP connection. This blog unveils how to leverage Linux Command Line Interface (CLI) tools, creating efficient data pipelines for ingestion through OTel's TCP receiver.

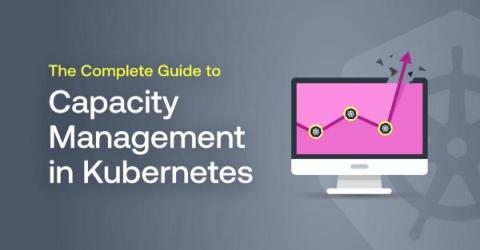
The Complete Guide to Capacity Management in Kubernetes

In the dynamic world of container orchestration, Kubernetes stands out as the undisputed champion, empowering organizations to scale and deploy applications seamlessly. Yet, as the deployment scope increases, so do the associated Kubernetes workload costs, and the need for effective resource capacity planning becomes more critical than ever. When dealing with containers and Kubernetes you can find yourself facing multiple challenges that can affect your cluster stability and your business performance.

Crossing the machine learning pilot to product chasm through MLOps

Numerous companies keep launching AI/ML features, specifically “ChatGPT for XYZ” type productization. Given the buzz around Large Language Models (LLMs), consumers and executives alike are growing to assume that building AI/ML-based products and features is easy. LLMs can appear to be magical as users experiment with them.

Better, Faster, Stronger Network Monitoring: Cribl and Model Driven Telemetry

New in Cribl 4.5, the Model Driven Telemetry Source enables you to collect, transform, and route Model Driven Telemetry (MDT) data. In this blog, you’ll learn how to explore the YANG Suite to understand the wide variety of datasets available to transmit as well as how to configure the tools to get data flowing from Cisco IOS XE network devices to Cribl Stream.

Find your logs data with Explore Logs: No LogQL required!

We are thrilled to announce the preview of Explore Logs, a new way to browse your logs without writing LogQL. In this post, we’ll cover why we built Explore Logs and we’ll dive deeper into some of its features, including at-a-glance breakdowns by label, detected fields, and our new pattern detection. At the end, we’ll tell you how you can try Explore Logs for yourself today. But let’s start from the beginning — with good old LogQL.