Operations | Monitoring | ITSM | DevOps | Cloud

Latest News

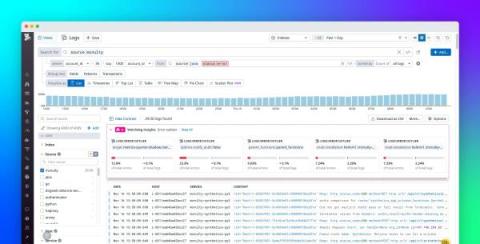
Filter and correlate logs dynamically using Subqueries

Logs provide valuable information that can help you troubleshoot performance issues, track usage patterns, and conduct security audits. To derive actionable insights from log sources and facilitate thorough investigations, Datadog Log Management provides an easy-to-use query editor that enables you to group logs into patterns with a single click or perform reference table lookups on-the-fly for in-depth analysis.

Open source log management tools in 2024

Log management tools provide visibility into the performance and behavior of systems, applications, networks, and infrastructure components. By collecting and analyzing logs, you can monitor for anomalies, track trends, and identify potential issues before they escalate. Choosing the right log management solution requires careful consideration of several factors to ensure that it meets your specific needs and goals. Here are the most popular open source log management tools to help you choose.

How to Manage Sensitive Log Data

According to Statistia, the total number of data breaches reached an all-time high of 3,205 in 2023, affecting more than 350 million individuals worldwide. These breaches primarily occurred in the Healthcare, Financial Services, Manufacturing, Professional Services, and Technology sectors. The mishandling of sensitive log data provides an on-ramp to many of the most common attack vectors.
Sponsored Post

5 Proactive Security Engineering Techniques for Cloud-Native Teams

Developing a proactive security strategy can potentially save an organization millions of dollars per year. According to IBM, the average cost of a data breach in 2023 added up to a staggering $4.45 million, up 15% over the last three years. This is especially true for cloud-native environments, which face unique security challenges due to their dynamic nature. Instead of waiting to respond to cybersecurity incidents after they happen, it's much better to embrace a proactive approach, and prevent them in the first place.

How to Search Your Cloud Data - With No Data Movement

Organizations are building data lakes and bringing data together from many systems in raw format into these data lakes, hoping to process and extract differentiated value out of this data. However, if you’re trying to get value out of operational data, whether on prem or in the cloud, there are inherent risks and costs associated with moving data from one environment to another.

Sending PHP Single-Page Application Logs to Loggly

In this post, we’ll embark on the journey of building a simple PHP single-page application that interacts with a MySQL database. We’ll integrate logging functionality on top of our application. Logging is a crucial aspect of any application—for providing insights into user behavior, tracking errors, and monitoring performance. We’ll start by walking through how to set up our application.

Charting New Territory: OpenTelemetry Embraces Profiling

The topic of continuous profiling has been an ongoing discussion in the observability world for some time. I said back in 2021 that profiling was set to be the next major telemetry signal in observability, and in fact, since then there’s been growing interest in profiles. Startups and large observability vendors have gotten into this domain. A significant recent step was when the OpenTelemetry project decided to add profiles to its core signals and formalized the open unified specification for that.

One Reason Why Your Nodes' Memory Usage Is Running High

When you’re using Cribl Stream and Cribl Edge to send data to hundreds of Splunk indexers using Load Balancing-enabed Destinations, it is sometimes necessary to analyze memory usage. In this blog post, we delve into buffer management, memory usage calculations, and mitigation strategies to help you optimize your configuration and avoid memory issues.

What you're currently missing from your CDN monitoring tool

Content Delivery Networks (CDN) have been an inherent part of modern software infrastructure for years. They allow for faster and more reliable web-content delivery to users regardless of their location and an additional level of protection against DDoS Attacks and server failure. But just like any infrastructure service, they still fail from time to time and have their quirks. Enter CDN monitoring tools, providing insights on the performance of your CDN and helping troubleshoot issues.

Stream Amazon CloudWatch Logs to Splunk Using AWS Lambda

Amazon CloudWatch Logs enables you to centralize the logs from different AWS services, logs from your applications running in AWS and on-prem servers, using a single highly scalable service. You can then easily view these logs data, search them for specific error codes or patterns, filter them based on specific fields, or archive them securely for future analysis.