Operations | Monitoring | ITSM | DevOps | Cloud

Latest News

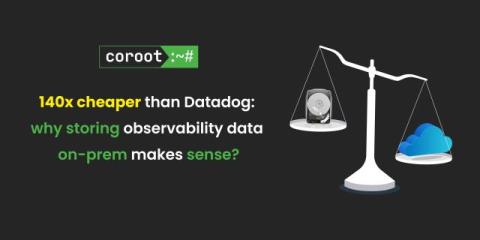
140x cheaper than Datadog: why storing observability data on-prem makes sense

I’ve heard this story many times from production engineers: ‘We use tools like Datadog and NewRelic, but to keep costs from skyrocketing, we’re only monitoring our most critical services. We’re storing just 10% of our logs and traces and only the metrics we consider essential. It’s a frustrating situation. Engineers want full visibility across their systems, but cloud storage costs make it impossible to monitor everything.

Application Performance Monitoring (APM) Guide for DevOps Teams in 2024

In today's rapidly evolving technology landscape, Application Performance Monitoring (APM) has become a critical component for DevOps teams striving to maintain high-performing, reliable applications. This comprehensive guide explores everything modern DevOps teams need to know about implementing and optimizing their APM strategy.

Kentik Named a Value Leader in EMA's 2024 Radar Report for Network Operations Observability

We are excited to share that Kentik has been named a Value Leader in EMA’s 2024 Radar Report for Network Operations Observability. This recognition highlights our continued commitment to building an AI-powered, end-to-end observability platform for modern networks, helping network and cloud teams optimize their infrastructures for availability, performance, cost-efficiency, and security.

Observability 2.0: Don't repeat sins of the past

If you are moving in the observability circles, chances are that you have heard the phrase “Observability 2.0,” which refers to how we need a new approach to observability. I am incredibly excited about the energy and discussion around a shift to “Observability 2.0,” as we now have a second chance to develop observability the way it was originally envisioned.

Tracing the Line: Understanding Logs vs. Traces

In the software space, we spend a lot of time defining the terminology that describes our roles, implementations, and ways of working. These terms help us share fundamental concepts that improve our software and let us better manage our software solutions. To optimize your software solutions and help you implement system observability, this blog post will share the key differences between logs vs traces.

Top 12 SolarWinds Competitors and Alternatives In 2024

Organizations exploring SolarWinds alternatives often face a critical decision when choosing the right network and infrastructure monitoring solution. While SolarWinds has established itself as a reliable industry standard, companies are increasingly seeking alternatives that offer better alignment with their monitoring needs, budget constraints, and security requirements.

LLM Monitoring and Observability

The demand for LLM is rapidly increasing—it’s estimated that there will be 750 million apps using LLMs by 2025. As a result, the need for LLM observability and monitoring tools is also rising. In this blog, we’ll dive into what LLM monitoring and observability are, why they’re both crucial and how we can track various metrics to ensure our model isn’t just working but thriving.

Against Incident Severities and in Favor of Incident Types

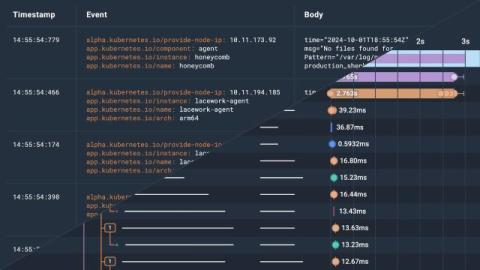
About a year ago, Honeycomb kicked off an internal experiment to structure how we do incident response. We looked at the usual severity-based approach (usually using a SEV scale), but decided to adopt an approach based on types, aiming to better play the role of quick definitions for multiple departments put together. This post is a short report on our experience doing it.

Observability as a superpower

With every job I have, I come across a new observability tool that I can’t live without. It’s also something that’s a superpower for us at incident.io: we often detect bugs faster than our customers can report them to us. A couple of jobs ago, that was Prometheus. In my previous job, it was the fact that we retained all of our logs for 30 days, and had them available to search using the Elastic stack (back then, the ELK stack: Elasticsearch, Logstash, and Kibana).

Network Observability: Mastering Infrastructure Data for Smarter IT

If you want to know exactly what’s on your network and how it’s all connected in real time, then network observability is the answer. Network observability pulls data from sources across your network infrastructure to model a detailed view of your systems and how they interact. This lets you understand exactly what’s happening on your network at any given moment so you can optimize performance.