Operations | Monitoring | ITSM | DevOps | Cloud

Latest News

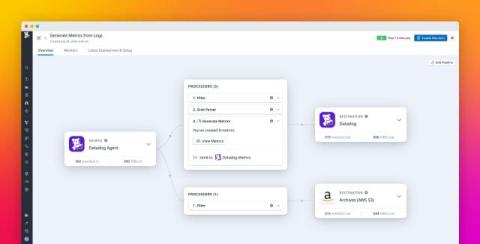
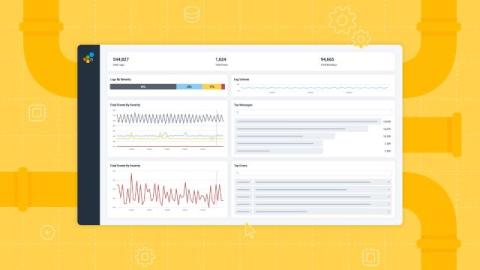
Generate metrics from your high-volume logs with Datadog Observability Pipelines

Logs are a rich source of information, providing you with the minute details you need to troubleshoot a specific issue or perform extensive historical analysis. But with billions of logs being generated from your infrastructure every day, it isn’t practical to sift through them all to derive actionable insights. Firewall, CDN, network activity, and load balancer logs are especially high volume, requiring storage solutions that can be expensive and difficult to scale.

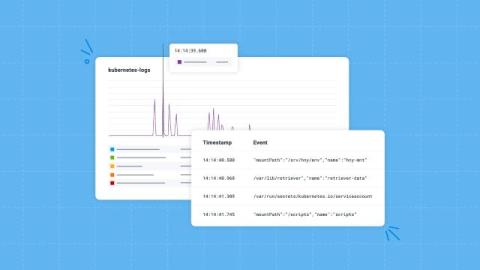
Debugging Kubernetes Autoscaling with Honeycomb Log Analytics

Let’s be real, we’ve never been huge fans of conventional unstructured logs at Honeycomb. From the very start, we’ve emitted from our own codestructured wide events and distributed traces with well-formed schemas. Fortunately (because it avoids reinventing the wheel) and unfortunately (because it doesn’t adhere to our standards for observability) for us, not all the software we run is written by us.

Leveraging AI for Predictive Analytics in Observability

Predictive analytics has become a key goal in observability. If teams can foresee potential system failures, performance bottlenecks, or resource constraints before they happen, they can act preemptively to mitigate issues. AI holds the promise of making this possible. In this post, we explore how AI can push observability toward predictive analytics, the industry’s current hurdles, and practical use cases for leveraging AI today.

Digitate's Flamingo release advances AI and unified observability to power the autonomous enterprise

Digitate announces the general availability of ignio™ Flamingo, featuring a robust suite of AI-driven capabilities across its award-winning products and solutions to further the vision of an autonomous enterprise.

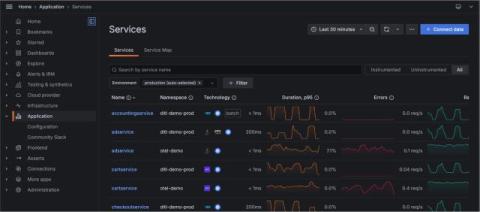
How to quickly configure Grafana Cloud Application Observability with Open Telemetry Operator

Monitoring application health is a lot like monitoring your personal health. Vital signs such as heart rate, blood pressure, and overall well-being can spot problems before they escalate, helping us maintain good health. Similarly, application health requires constant monitoring of performance indicators like CPU usage, memory consumption, and application response times.

How to Use FastAPI [Detailed Python Guide]

FastAPI Python combines modern Python features with high-performance web development capabilities. This framework stands out for its speed, ease of use, and built-in support for asynchronous programming. Whether you're building APIs, microservices, or full-stack applications, FastAPI offers tools to streamline your development process.

Unlock the Real Value of Logs With Honeycomb Telemetry Pipeline and Honeycomb for Log Analytics

At Honeycomb, we know how important it is for organizations to have a unified observability platform. This is why we’re launching Honeycomb Telemetry Pipeline and Honeycomb for Log Analytics: to enable engineering teams to send and analyze data—including logs—into a single, unified platform. For too long, teams have had to wrangle large volumes of logs, their context scattered across multiple teams and tools, leading to knowledge silos.

How Generative AI Is Revolutionizing Debugging

In the rapidly evolving landscape of software development, the integration of generative AI has become a game-changer for organizations striving to deliver high-quality software at scale. Among its many transformative applications, autonomous debugging stands out as a critical advancement, offering the potential to revolutionize the way development teams tackle errors and maintain operational efficiency.

Comprehensive Observability: Key Performance Metrics to Monitor in Cloud Environments

Enterprises need strong observability to ensure system reliability, proactively detect and resolve issues, optimize performance, enhance security, and maintain seamless business operations across complex distributed environments.