Operations | Monitoring | ITSM | DevOps | Cloud

Latest News

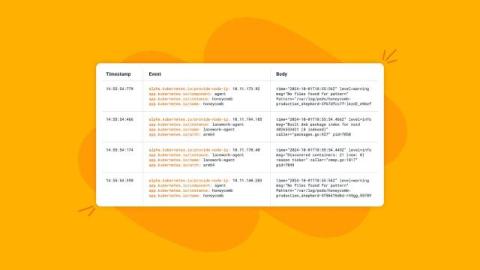
The OTTL Cookbook: Common Solutions to Data Transformation Problems

As our software complexity increases, so does our telemetry—and as our telemetry increases, it needs more and more tweaking en route to its final destination. You’ve likely needed to change an attribute, parse a log body, or touch up a metric before it landed in your backend of choice. At Honeycomb, we think the OpenTelemetry Collector is the perfect tool to handle data transformation in flight. The Collector can receive data, process it, and then export it wherever it needs to go.

Beyond Backend: Honeycomb for Frontend Observability is Now GA

Real user monitoring (RUM) tools are great if you want to give your developers a very high level view of the health of your frontend. But when it comes to actually debugging issues in your web app, you’re often left piecing together outputs from browser devtools, with details (if you’re lucky) from customer support tickets to replicate issues locally in hopes of identifying the source of the issue. Debugging Core Web Vitals (CWVs) to improve your scores can be even worse.

Debugging INP With Honeycomb for Frontend Observability

Interaction to Next Paint is the newest of Google’s Core Web Vitals. The three metrics that make up the CWVs are Google’s attempt at defining proxy metrics for measuring things they believe are critical to a good user experience on the web. The three metrics are: Debugging and fixing these metrics can be quite complicated. In this post, I’m going to walk through how you can use Honeycomb for Frontend Observability to debug INP, which was just promoted to a stable Core Web Vital in March.

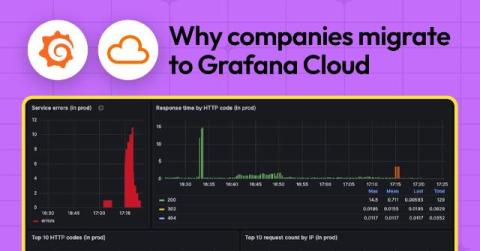
Lower observability bills, reduced MTTR, and more: why companies migrate to Grafana Cloud

There are a lot of factors that go into choosing an observability solution. And even after all that careful consideration, sometimes the platform you initially invest in doesn’t meet your needs, especially as your organization grows and evolves. For that very reason, we’ve seen users begin their observability journeys with another tool, and then decide to migrate to Grafana Cloud, our fully managed cloud-hosted observability platform.

Grafana vs Splunk - Features, Pricing, and Performance Compared [2024]

Monitoring and observability tools are critical for organizations to keep their systems running efficiently. Grafana and Splunk are two leading platforms that cater to various observability needs, but they differ significantly in functionality, user base, and cost. This article will explore their features, strengths, and limitations to help you choose the right tool for your use case.

An Engineer's Checklist of Logging Best Practices

The best DevOps and SRE teams have shifted their approach to monitoring and logging their systems. These teams debug problems cohesively and rationally, regardless of the system’s complexity. Gone are the days of having a slew of logs that fail to explain the cause of alerts, system failures, and other unknowns.

How OpenTelemetry is Transforming Observability

The OpenTelemetry project is changing how organizations approach observability. It aims to standardize monitoring across different systems. OpenTelemetry—commonly referred to as OTel—provides APIs, SDKs, exporters, and collectors. It is making data collection, analysis, and utilization more efficient, leading to better decision-making and technology adoption.

A CoPE's Duty: Indexing on Prod

Odds are that a software engineer today is really focused on one place: pre-prod. Short for “pre-production,” this is slang for an environment where software code operates in a prototype phase of its development lifecycle. Common sense would have one believe that this is a safe space, a workbench of sorts, where problems can be found and remediated.

Splunk vs Dynatrace - Detailed Comparison [2024]

Splunk and Dynatrace are two powerful platforms in the realm of observability and performance monitoring. Each offers unique strengths that cater to different monitoring needs. In this article, we'll explore the features, pros, and cons of both tools, and introduce an exciting alternative that combines the best of both worlds.