Operations | Monitoring | ITSM | DevOps | Cloud

Latest News

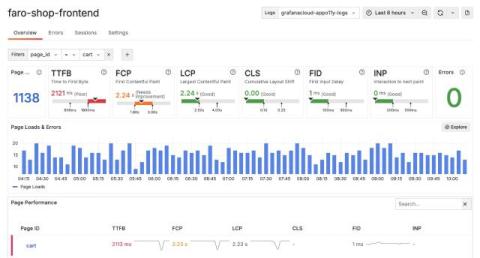
Gain actionable insights with real user monitoring: the latest features in Grafana Cloud Frontend Observability

One of the biggest challenges observability teams face today is gaining end-to-end visibility into their cloud native apps, including modern browser frontends. Without that visibility, you potentially open the door to bad end-user experiences that can hurt customer satisfaction, reduce search engine discoverability, and interfere with overall business goals. This is the exact challenge we address with Grafana Cloud Frontend Observability.

Top 10 APM Tools - Comprehensive Comparison [2024 Guide]

Application Performance Monitoring (APM) tools are essential in software development landscape. As applications become more complex, ensuring they perform optimally has never been more critical. APM tools allow developers to monitor, diagnose, and optimize applications, ensuring a seamless user experience. In this article, we'll explore the top 10 APM tools available today, highlighting their features, pros, and cons to help you make an informed decision.

Why Observability is Critical to Cyber Resilience

Whether an enterprise operates in technology, healthcare, financial services, or another business vertical, cybersecurity must remain top of mind. In addition to the numerous international cybersecurity regulations, like the NIST Cybersecurity Framework, GDPR, and other mandates, enterprises must also prioritize cybersecurity to mitigate downtime, protect sensitive data, and uphold customer trust and brand reputation.

Building On-call: Our observability strategy

At incident.io, we run an on-call product. Our customers need to be sure that when their systems go wrong, we’ll tell them about it—high availability is a core requirement for us. To achieve the level of reliability that’s essential to our customers, excellent observability (o11y) is one of the most important tools in our belt. When done right, observability improves your product experience from two angles.

What Is Full-Stack Observability?

Monitoring used to be so easy. Servers had names and lived down the hall, or across the street. If things weren’t working, you could turn them on and off again. Database filling up? Just throw another hard drive in there. Too many simultaneous requests? Rack another server and install a cache. Fast forward a couple decades, and things have gotten much more complicated.

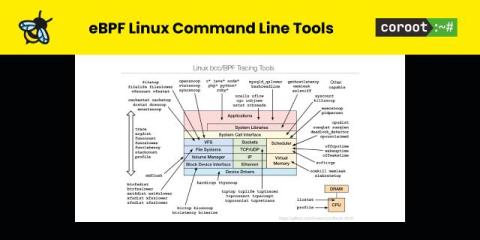
eBPF Linux Command Line Tools

eBPF is a powerful technology used by many observability solutions, including Coroot. While web-based observability tools like Coroot are invaluable, there’s a specific class of eBPF tools that often go overlooked (besides Brendan Gregg of course): eBPF Linux Command Line Tools. These tools are essential for diving deep into complex performance issues. But first – why would you need those at all if you have convenient observability focused web applications?

runqlat and runqslower - eBPF command line tools

In this blog post we will look at runqlat and runqslower commands. They are available in both BCC and bpftrace tool collections. One of the core functions of Linux operating system is to schedule processes across available CPUs. When service gets a request, Linux typically will need to schedule the process, processing that request to run on one of CPUs. This might be very quick process if idle CPU is available or it can take significant time, if all CPUs are currently busy running different processes.

gethostlatency - eBPF Command Line Tools

In this blog post we will look at gethostlatency command. It is available in both BCC and bpftrace tool collections. Most applications and services use hostnames, rather than IP addresses to communicate with other services. This means before connection to the service can be established, another request needs to be made – to DNS (Domain Name System). As such its performance and availability impacts performance of virtually all services in your environment, yet it is often ignored.