Operations | Monitoring | ITSM | DevOps | Cloud

Latest News

Getting Started With Refinery: Rules File Template

Sampling is a necessity for applications at scale. We at Honeycomb sample our data through the use of our Refinery tool, and we recommend that you do too. But how do you get started? Do you simply a set rate for all data and a handful of drop and keep rules, or is there more to it? What do these rules even mean, and how do you implement them? To answer these questions, let’s look at a rules file template that we use for customers when first trying out Refinery.

Observability vs Monitoring [Understanding the Key Differences in 2024]

When systems fail, it's not just a technical hiccup – it's a business problem. Downtime means unhappy customers and lost revenue. That's why teams need effective ways to spot issues fast and fix them even faster. This is where monitoring and observability come into play. Monitoring and observability are two key approaches to keeping your systems running smoothly. Monitoring is like your system's alarm bell – it tells you when something's wrong.

Lumigo Introduces AI to Simplify Observability Workflows

Lumigo is expanding its troubleshooting and observability platform with cutting-edge AI-powered tooling, now available in beta, which will provide developers and DevOps teams with the fastest and most cost-efficient way to debug and observe complex microservices. AI is quickly reshaping the technology landscape. However, observability tools have been slow to find ways to leverage AI in a fashion that provides tangible value.

How Australian local governments can use cloud-native observability

Australian city councils are the command centers of every city, ensuring essential services are delivered with reliability and speed while being available for citizens' queries and requests. Though the IT infrastructure of Australian city councils has predominantly been on-premises, the last decade has seen a substantial digital shift with increasing cloud adoption.

Prometheus vs InfluxDB [Detailed Technical Comparison for 2024]

Prometheus and InfluxDB represent two distinct approaches to time-series data management and system monitoring. As organizations grapple with increasing data volumes and complex infrastructures, choosing the right tool becomes crucial. This analysis dives deep into the technical nuances of Prometheus and InfluxDB, examining their architectures, data models, and performance characteristics.

Grafana vs Prometheus [Detailed Technical Comparison for 2024]

Grafana and Prometheus have become integral components in observability stacks. This comprehensive analysis examines Grafana and Prometheus, two leading open-source tools that address critical aspects of system observability. We'll dissect their architectures, compare key features, and evaluate their performance in various deployment scenarios.

Mastering Kubernetes Logging - Detailed Guide to kubectl logs

Effective logging is crucial for maintaining and troubleshooting applications running in Kubernetes clusters. As applications become more complex, ensuring they perform optimally has never been more critical. In this comprehensive guide, we'll explore Kubernetes logging using kubectl, covering everything from basic commands to advanced techniques and best practices.

Best Practices for Using JIT Access as Part of Developer Observability

JIT Access, sometimes referred to as just-in-time provisioning or just-in-time privileged access management (JIT PAM), is a security strategy that grants users access privileges for limited time periods. Access is granted on an “as-needed” basis. For example, if a developer requires access to a specific platform for a week or as part of an on-call access to production duty, a JIT Access system can provide that access and automatically revoke it after the time period ends.

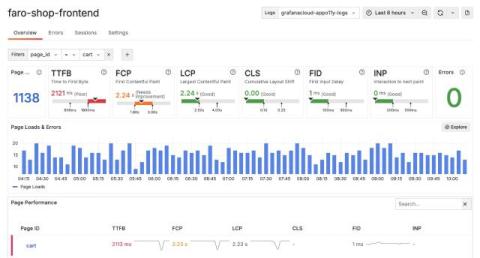
Gain actionable insights with real user monitoring: the latest features in Grafana Cloud Frontend Observability

One of the biggest challenges observability teams face today is gaining end-to-end visibility into their cloud native apps, including modern browser frontends. Without that visibility, you potentially open the door to bad end-user experiences that can hurt customer satisfaction, reduce search engine discoverability, and interfere with overall business goals. This is the exact challenge we address with Grafana Cloud Frontend Observability.