Operations | Monitoring | ITSM | DevOps | Cloud

Latest News

The Layers, Not Pillars, of Observability

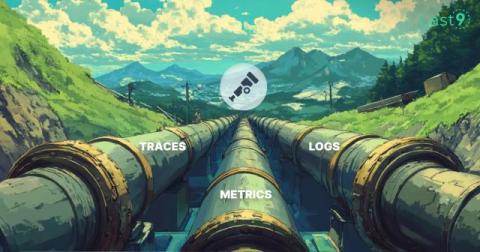
Remember the Tabs vs. Spaces arguments? It seems that observability has grown up enough that we are arguing over which signals are the “best” signals for observability. Often referred to as the Pillars of Observability, Metrics, Logs, and Traces (sometimes adding Events for MELT) each provide a unique perspective on a system. What happens when we change our perspective from finding the “best” telemetry format to finding the telemetry that aligns with the problems we need to solve?

An Ode to Events

At this point, it’s almost passé to write a blog post comparing events to the three pillars. Nobody really wants to give up their position. Regardless, I’m going to talk about how great events are and use some analogies to try to get that across. Maybe these will help folks learn to really appreciate them and to depreciate a certain understanding of the three pillars. Or maybe not.

Top 11 Grafana Alternatives [comparison 2024]

Grafana is a widely used open-source platform for monitoring and visualization. Grafana has a lot of built-in functionality and also provides a large amount of community templates that can improve your overall experience. However, Grafana requires quite a lot of configuration and the documentation can be a bit overwhelming for beginners. In this article, we explore seven alternatives that can be simpler to use and can provide seamless integration of traces, logs, and metrics.

Top 10 API Monitoring Tools in 2024 [Including Open Source]

API monitoring has become increasingly important due to the growth of microservices, cloud-native architectures, and distributed systems. APIs play a crucial role in facilitating communication between systems, and even small API failures can cause significant disruptions in service delivery. This article delves into the best API monitoring tools available in 2024, encompassing both proprietary and open-source options, to assist you in selecting the most suitable solution for your business requirements.

Is OpenTelemetry Open for Business? September 2024 Update

One of the things about OpenTelemetry that’s easy to miss if you’re not spending the whole day in the ins and outs of the project is just how much stuff it can do—but that’s what I’m here for! Today, I want to go through the project and give you a guide to the various parts of OpenTelemetry, how mature they are, and what you can expect over the next six months or so. I ranked these elements by relative maturity across the entire project.

Introducing Ingest Guard - A Game-Changer for Observability Cost Control

It’s day 1 of SigNoz Launch Week 2.0, and we’re releasing Ingest Guard, a feature that will help platform and finops teams have granular control over data ingestion and observability costs. At SigNoz, we are constantly evolving to meet the needs of modern engineering teams, and this launch week, we're excited to introduce a highly anticipated feature—Ingest Guard.

Introducing The eBPF Agent: A New, No-Code Approach for Cloud-Native Observability

Microservices architecture has become a dominant approach for building scalable, resilient, and flexible applications. However, monitoring these microservices presents unique challenges due to their distributed nature, fixed or limited resources, enterprise scale, and the dynamic nature of environments, such as Kubernetes clusters. The result is that in-process application agents often introduce significant overhead because they rely on intrusive instrumentation and frequent polling.

Broadcom's Vision for Network Observability

The performance monitoring industry has been using the word “observability” to a lot of different ends lately. While the trend towards more visibility into services is a good one, it’s also based on a need we see from customers on a day-to-day basis. The need to take back control of network visibility is strong in the face of complexity that has been rapidly increasing for years.

Kibana vs Grafana - Comparison for Advanced Monitoring and Observability [2024 Guide]

Kibana and Grafana are the leading options when selecting a tool for observability and monitoring in cloud environments. This guide extensively explores their variances to assist you in selecting the most suitable option for your requirements. Understanding these tools is crucial for effective system monitoring, whether managing a small startup or a large enterprise.