Operations | Monitoring | ITSM | DevOps | Cloud

Latest News

How to scale observability for AWS hybrid and multi-cloud environments

Managing observability across hybrid and multi-cloud environments is like flying a fleet of planes, each with different routes, altitudes, and destinations. You’re not just piloting a single aircraft; you’re coordinating across multiple clouds, on-premises systems, and services while ensuring performance, availability, and cost-efficiency. AWS customers, in particular, face challenges with workloads spanning multiple regions, data centers, and cloud providers.

Understanding Jaeger - From Basics to Advanced Distributed Tracing

Jaeger has emerged as a crucial tool in the modern distributed systems landscape, offering powerful tracing capabilities that help organizations understand and optimize their microservices architectures. This comprehensive guide explores everything from basic concepts to advanced implementations, providing you with the knowledge needed to effectively implement and utilize Jaeger in your environment.

Comprehensive Observability: Key User Experience Metrics to Monitor in Cloud Environments

As we conclude our three-part series on key observability metrics ScienceLogic monitors, this blog focuses on the analysis and impact of user experience (UX) metrics to shed light on their business impact. Whether it’s an internal business application or a customer-facing platform, a seamless and efficient user experience can significantly impact satisfaction, productivity, and loyalty.

How observability, AI and automation is leading the workload management evolution

Workload management is ubiquitous when it comes to automating critical business processes. With time, workload management as a technology is going through a gradual evolution, from ‘just automation’ to an orchestrator of intelligent automation. This necessitates a layer of observability and intelligence to facilitate the move from workload automation to workload management.

Determining a CoPE's Efficacy-and Everything After

As discussed in the first article in this series, a Center of Production Excellence (CoPE) is a more or less formal, provisional subsystem within an organization. Its purpose is to act from within to change that organization so that it’s more capable of achieving production excellence. The series has, to date, focused mainly on how best to construct such a subsystem and what activities it should pursue.

Reduce Observability Costs with OpenTelemetry Setup

Maintaining and visualizing telemetry data efficiently is super important for DevOps and SecOps teams. OpenTelemetry, a fantastic open-source observability framework, can really help with this without being too costly. Picture having a simple process that improves your data and helps your team make smart decisions without spending too much money. Let's chat about some budget-friendly ways to set up OpenTelemetry agents.

State of Observability 2024 Reveals How Leaders Outpace Their Peers

In 2024, simply having an observability practice is a given. In this era of observability, a high-functioning team will set leaders apart from their peers. Leading observability practitioners don’t fix issues by putting hundreds of people into a virtual room, or frantically messaging in a temporary Slack channel to find root causes. Because leaders embed observability into their development practices early, a feature launch is a quiet non-event.

Gaining End-to-End Network Observability in a Multi-Cloud World

In a relatively short period of time, networks have grown much bigger, much more complex, and much more critical to the ongoing operation of the business. Quite simply, while ensuring optimized network services has never been more critical, it’s also never been more difficult. In many large enterprises, network operations teams are seeing tens of thousands of endpoints added to already complex internal environments.

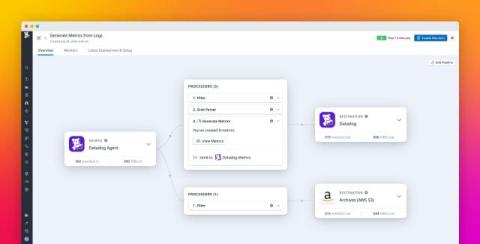
Generate metrics from your high-volume logs with Datadog Observability Pipelines

Logs are a rich source of information, providing you with the minute details you need to troubleshoot a specific issue or perform extensive historical analysis. But with billions of logs being generated from your infrastructure every day, it isn’t practical to sift through them all to derive actionable insights. Firewall, CDN, network activity, and load balancer logs are especially high volume, requiring storage solutions that can be expensive and difficult to scale.

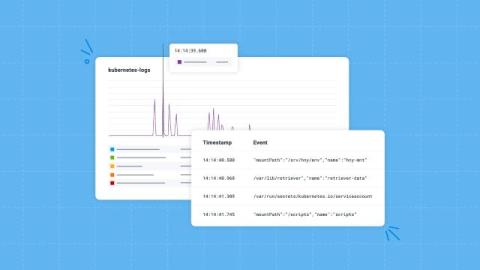
Debugging Kubernetes Autoscaling with Honeycomb Log Analytics

Let’s be real, we’ve never been huge fans of conventional unstructured logs at Honeycomb. From the very start, we’ve emitted from our own codestructured wide events and distributed traces with well-formed schemas. Fortunately (because it avoids reinventing the wheel) and unfortunately (because it doesn’t adhere to our standards for observability) for us, not all the software we run is written by us.