Operations | Monitoring | ITSM | DevOps | Cloud

Latest News

Ask Miss O11y: Is There a Beginner's Guide On How to Add Observability to Your Applications?

I want to make my microservices more observable. Currently, I only have logs. I’ll add metrics soon, but I’m not really sure if there is a set path you follow. Is there a beginner's guide to observability of some sort, or best practice, like you have to have x kinds of metrics? I just want to know what all possibilities are out there. I am very new to this space.

Sponsored Post

The Risks and Pitfalls of Too Many Monitoring Tools

If you are like most organizations, your technology environment is a complex mixture of tools needed to run your business. In this environment, monitoring and observability are critical to making sure everything is running smoothly. You use monitoring tools to measure server resources, log-parsing tools for troubleshooting, application tools to observe application performance, and audit-request tools to comply with regulations. While these are all valid observability needs, there are risks to overdoing it by introducing too many tools. Here are some ways to avoid monitoring proliferation when developing your observability strategy.

Level Up Your Observability Game With the Cribl Suite of Products: All About Our 4.1 Release

After our recent company-wide offsite in New Orleans, the Cribl employees are feeling like they’ve leveled up in more ways than one. Not only did we indulge in delicious beignets and king cakes, but we also came back motivated to create some kick-ass new product features with our 4.1 release. It’s like we soaked up all the good vibes and brought them back with us.

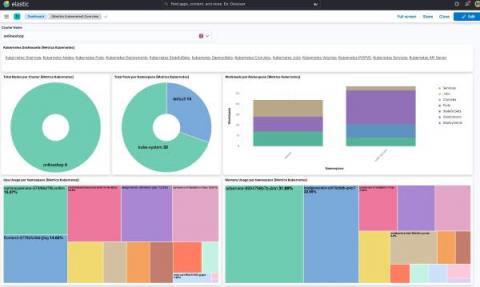
SaaS Observability Platforms: A Buyer's Guide

Observability is the ability to gather data from metrics, logs, traces, and other sources, and use that data to form a complete picture of a system’s behavior, performance, and health. While monitoring alone was once the go-to approach for managing IT infrastructure, observability goes further, allowing IT teams to detect and understand unexpected or unknown events.

How Do We Cultivate the End User Community Within Cloud-Native Projects?

The open source community talks a lot about the problem of aligning incentives. If you’re not familiar with the discourse, most of this conversation so far has centered around the most classic model of open source: the solo unpaid developer who maintains a tiny but essential library that’s holding up half the internet. For example, Denis Pushkarev, the solo maintainer of popular JavaScript library core-js, announced that he can’t continue if not better compensated.

How We Define SRE Work, as a Team

Last year, I wrote How We Define SRE Work. This article described how I came up with the charter for the SRE team, which we bootstrapped right around then. It’s been a while. The SRE team is now four engineers and a manager. We are involved in all sorts of things across the organization, across all sorts of spheres. We are embedded in teams and we handle training, vendor management, capacity planning, cluster updates, tooling, and so on.

MIAX and Cribl Stream: Enriching Data for Improved Observability and Faster Time to Value

Using Cribl Stream for observability is a given, but what about using Cribl Stream to get MORE from your data? Observability is all about being able to collect, route, store, and search your data. Implementing enrichment with observability provides more context and elevates your ho-hum data to robust information. This is key to faster, more confident decision-making!

Gain real-time observability into your software supply chain with the New Relic Log Analytics Integration

JFrog’s new log analytics integration with New Relic brings together powerful observability capabilities to monitor, analyze, and visualize logs and metrics from self-hosted JFrog environments. The integration is free for all tiers of self-hosted JFrog customers and utilizes the powerful, open source log management tool, Fluentd, to collect, process, and surface data in New Relic dashboards.

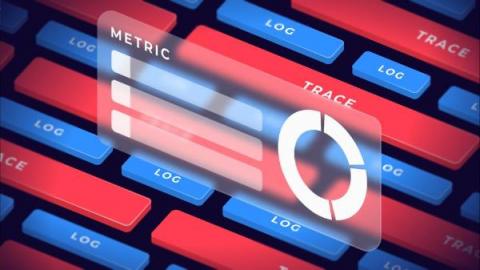
Metrics vs. Logs vs. Traces (vs. Profiles)

In software observability, we often talk about three signal types - metrics, logs, and distributed traces. More recently I've been hearing about profiles as another signal type. In this article I will explain the different observability signals and when to use them in a clear and concise way.