Operations | Monitoring | ITSM | DevOps | Cloud
Latest News
How to install a High Availability Database Cluster with Pandora FMS
Pandora FMS relies on a MySQL database for configuration and data storage. A database failure can temporarily bring your monitoring solution to a halt. The Pandora FMS high availability database cluster allows you to easily deploy a fault-tolerant, robust architecture.
Sentry's New Java Agent: Adding Context to Your Stack Traces
We’re enhancing the existing Sentry Java SDK with our new Java agent. The thing is — it’s still in beta, and we need your feedback. Once downloaded, the agent will enhance your application stack traces on Sentry by adding the names and values of local variables to each frame. Specifically, the agent provides much more detail about the current state of the application at the time of the error than you would usually have.
Using Raygun with Google Tag Manager
If you want find out if end users are running into bugs, slow page load speeds and other hidden issues, or want to discover where and why people are falling out of your conversion funnels, Raygun is going to provide much needed visibility and answers for your team.
Key metrics for Elasticsearch performance monitoring
Elasticsearch is a highly scalable, distributed, open-source RESTful search and analytics engine that offers log analytics, real-time application monitoring, click stream analytics, and more. Elasticsearch stores and retrieves data structures in real time. It has multi-tenant capabilities with an HTTP web interface, presents data in the form of structured JSON documents, makes full-text search accessible via RESTful API, and maintains web clients for languages like PHP, Ruby, .Net, and Java.
Monitoring Java using JMX and custom metrics
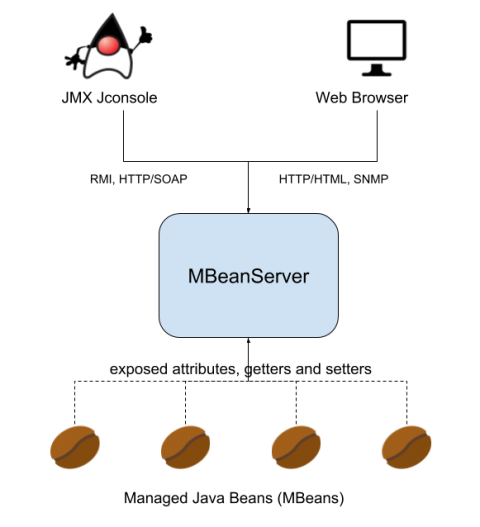
JMX (Java Management Extensions) is a set of specifications conceived to monitor and manage Java applications. To implement the JMX technology, you need to create and register MBeans (Managed Beans) as part of your Java code. Using JMX technology and tools, Java application developers can get the dynamic state of the application and use it for performance tuning, troubleshooting and debugging.
Monitor your domain, SSL certificate, blacklists and robots.txt
Super Monitoring introduced a new type of check: “Daily Health”, which checks once a day the domain and SSL certificate’s expiration dates, the validity of the certificate, presence of the site on blacklists and detects whether the website is blocking search engine robots.
Top 3 AWS Lambda Performance Monitoring Tools
Serverless is often described as the abstraction to end all abstractions. VMs and standalone containers pale in comparison stateless functions. That pristine distinction between the application’s code and its stateful data is something we all dream of. Scalability, observability and high availability can now be realized on a global scale.
Machine Learning with AWS Lambda
We all know the latest trend in today’s technology and how Machine Learning is changing the way business decisions are made. Machine learning replaces old manual repeatable processes and provides the systems the ability to get into a mode of self-learning without being explicitly programmed.
Alert fatigue, part 3: automating triage & remediation with check hooks & handlers
In many cases — as you’re monitoring a particular state of a system — you probably know some steps to triage or in some cases automatically fix the situation. Let’s take a look at how we can automate this using check hooks and handlers.


