Operations | Monitoring | ITSM | DevOps | Cloud

Latest News

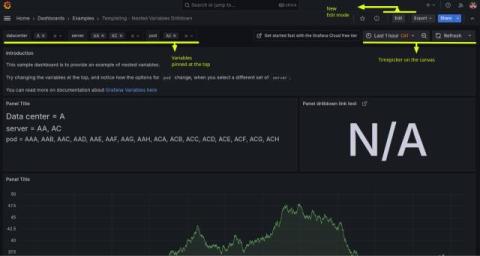
Grafana dashboards are now powered by Scenes: big changes, same UI

Though you might not immediately notice it the next time you log in, Grafana’s frontend has undergone a major upgrade. We recently migrated our dashboard architecture to utilize the Grafana Scenes library, enabling the creation of more stable, dynamic, and flexible Scenes-powered dashboards. Yes, the UI is pretty much the same, but under the hood, the engine responsible for visualizing the dashboards used by millions of people around the world has largely been rewritten.

Organizing your devices is a no-brainer with OpManager's smart grouping

An organized inventory for monitoring using ManageEngine OpManager is essential for resolving network issues and optimizing performance. Configuring and updating monitoring settings is easier and more efficient when devices and interfaces are organized into subgroups and supergroups. For instance, say you’re monitoring 500 or more devices.

Digital Workspace Sustainability: Tracking Carbon and Energy Consumption for IT Sustainability Goals

As the world moves towards sustainability, IT operations and digital workspaces are becoming critical in achieving corporate sustainability goals. The digital transformation of businesses—especially in light of hybrid and remote working models—has increased the demand for IT infrastructure, which in turn raises concerns about energy consumption, carbon emissions, and environmental impact.

Optimize Database Performance in Ruby on Rails and ActiveRecord

In Rails, we're more likely to use SQL databases than other frameworks. Unlike NoSQL databases, which can be scaled horizontally with relative ease, SQL databases like PostgreSQL or MySQL are much less amenable to easy scaling. As a result, our database usually becomes the primary bottleneck as our business grows. Although SQL databases are very efficient, as our growing customer base puts an increasing load on our servers, we begin scaling our instance counts, workers, etc.

Advanced Open edX Monitoring with AppSignal for Python

In the first part of this series, we explored how AppSignal can significantly enhance the robustness of Open edX platforms. We saw the challenges that Open edX faces as it scales and how AppSignal's features — including real-time performance monitoring and automated error tracking — provide essential tools for DevOps teams. Our walkthrough covered the initial setup and integration of AppSignal with Open edX, highlighting the immediate benefits of this powerful observability framework.

DORA Metrics in perspective

A friend of mine once had an annual appraisal where his manager blithely declared to him that his target for the next year was "to exceed his targets". Rather than spend the next year screaming silently whilst trapped inside an MC Esher-esque cycle of infinite recursion, my friend politely demurred and requested a more achievable goal, such as building a time machine out of jellybeans.

Anodot recognized as a Visionary in the 2024 Gartner Magic Quadrant for Cloud Financial Management Tools Report

The cloud financial landscape is expanding with more vendors for companies to choose from to maintain healthy cloud costs. As the market grows, it’s important to partner with a third-party cloud financial management tool built on FinOps innovation and consistently adapt to meet future customer needs. A credible source recommending the right cloud cost tool can help you make an informed choice that positively impacts your cloud cost optimization.

Fine-Tuning Kafka Producers and Consumers for Maximum Efficiency

Keeping Kafka running at peak efficiency takes more than just a smooth setup. Fine-tuning Kafka producers and consumers is key to making sure every message is processed quickly and accurately. A little tweaking here and there can help you avoid bottlenecks, increase throughput, and keep your whole data pipeline running smoothly. In this guide, we’ll dive into practical tips for configuring producers and consumers for maximum efficiency.

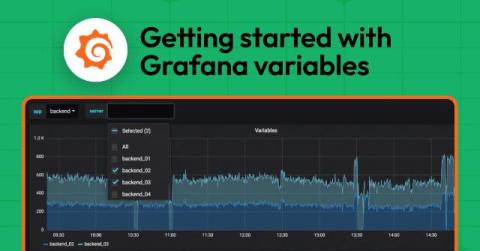
Grafana variables: what they are and how they create dynamic dashboards

A common pattern when building Grafana dashboards is to represent data for many items at once, such as simultaneously monitoring hundreds of servers. But what if there’s a problem with one of those servers? You’d want the ability to quickly identify that single server, and drill into the details without noise from all the other systems. In Grafana, dashboard variables are a great way to filter data and focus on the information that’s most important to you.