Operations | Monitoring | ITSM | DevOps | Cloud
Latest News
A DBA's Habits for Success: CMMI (Part One)
New Gartner AIOps Platform Market Guide Shows More Use Cases for Ops and Dev Teams
Gartner jumps right into it, describing a reorientation of a tool that has previously focused on IT service management and automation. AIOps is now also enabling a variety of new observability use cases for DevOps and Site Reliability Engineering (SRE) teams. This blog presents the guide’s major findings and a link so you can read the report for more details. About the AIOps Platform Market
FireHydrant April 2021 Product Updates: Incident Tags & Customizable Slack Incident Modals
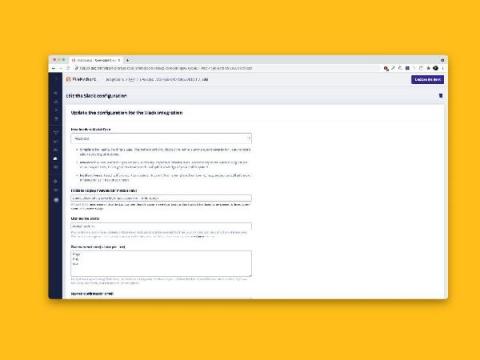
We're excited to announce the release of two new features this month: customizable Slack incident modals and Incident Tags. Keep reading to more about how they can help your teams manage incidents better!
Ubuntu Server 21.04:What's new?
Ubuntu Server 21.04 (Hirsute Hippo) brings significant improvements to automation and stability fronts with new extensions to the Ubuntu Server Live Installer and phased updates in the Advanced Package Tool (APT).
Fintech AI/ML on Ubuntu
The financial services (FS) industry is going through a period of change and disruption. Technology innovation has provided the means for financial institutions to reimagine the way in which they operate and interact with their customers, employees and the wider ecosystem. One significant area of development is the utilisation of artificial intelligence (AI) and machine learning (ML) which has the potential to positively transform the FS sector.
What is KFServing?
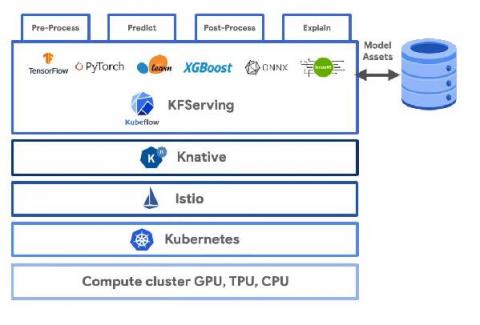
TL;DR: KFServing is a novel cloud-native multi-framework model serving tool for serverless inference. KFServing was born as part of the Kubeflow project, a joint effort between AI/ML industry leaders to standardize machine learning operations on top of Kubernetes. It aims at solving the difficulties of model deployment to production through the “model as data” approach, i.e. providing an API for inference requests.
Can I Send an Alert to Discord?
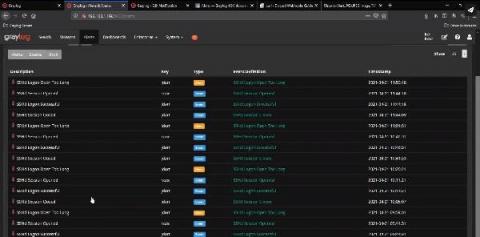
This is a great question. The answer is yes. You can send Graylog alerts via email, text, or Slack, and now Discord. Yes Discord! The growth and use of Discord has transformed from just many Gaming users to businesses using it as a communication platform. Many businesses like: Gaming Developers, Publishers, Journalists, Community and Event Organizers use Discord. Discord lets Gamer Developers work in teams with each other on their projects.
Cloud Migration Strategy [Guide]
Migrating to cloud infrastructure is one of the most critical requirements for modern enterprises to ensure long-term sustainability. Initially, there was a general apprehension about adopting cloud technology and developing a cloud migration strategy; certain aspects like security and resilience were concerns. But today, with increasing technological advancements and familiarity, there is not an iota of doubt that the advantages of adopting cloud technology have far outnumbered the few drawbacks.
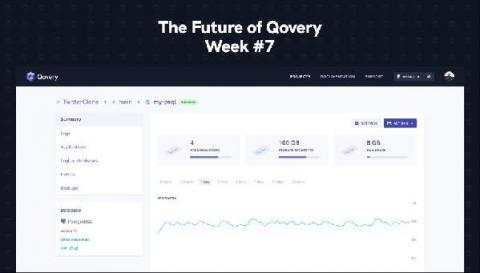
The easiest way to deploy your database - The Future of Qovery - Week #7
During the next four weeks, our team will work to improve the overall experience of Qovery. We gathered all your feedback (thank you to our wonderful community 🙏), and we decided to make significant changes to make Qovery a better place to deploy and manage your apps. This series will reveal all the changes and features you will get in the next major release of Qovery. Let's go!


