Operations | Monitoring | ITSM | DevOps | Cloud

Latest News

Graphite Monitoring Tool Tutorial

In this post, we will go through the process of configuring and installing Graphite on an Ubuntu machine. What is Graphite Monitoring? In short; Graphite stores, collects, and visualizes time-series data in real time. It provides operations teams with instrumentation, allowing for visibility on varying levels of granularity concerning the behavior and mannerisms of the system. This leads to error detection, resolution, and continuous improvement. Graphite is composed of the following components.

Redefining Financial Services with On-Demand Virtual Servers

In the fast-paced world of finance, staying ahead of the curve is essential. Technology plays a pivotal role in this endeavor, and one of the key innovations transforming the financial services industry is the utilization of on-demand virtual financial servers. These versatile tools are revolutionizing the way financial institutions operate, enhancing efficiency, security, and scalability. In this blog post, we'll explore how on-demand virtual financial servers are redefining financial services.

VMware Tanzu Service Mesh Named a Leader in 2023 GigaOm Radar Report on Service Mesh

GigaOm has once again placed VMware Tanzu Service Mesh within the leader ring of its Radar Report on Service Mesh. This year Tanzu Service Mesh has been upgraded to the Outperformer label, moving closer to the center and marking its heightened recognition as an industry leader. This is not only a testament to our robust enterprise capabilities and broad support for various application platforms, public clouds, and runtime environments, but also a validation of our strategic approach.

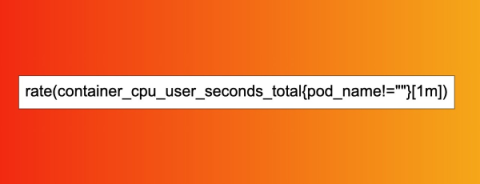
Getting started with PromQL

This article will focus on the popular monitoring tool Prometheus, and how to use PromQL. Prometheus uses Golang and allows simultaneous monitoring of many services and systems. In order to enable better monitoring of these multi-component systems, Prometheus has strong built-in data storage and tagging functionalities. To use PromQL to query these metrics you need to understand the architecture of data storage in Prometheus, and how the metric naming and tagging works.

Accessibility testing with Cypress

Effective user experience (UX) design is a key factor in creating compelling software products. UX considers the quality of interaction that users have with a product and takes the user’s point of view as the most sacred thing in software and product design. A great UX includes accessibility, which ensures that software is inclusive and usable by the widest possible audience.

Unlocking IT: Considerations for a Powerful Observability Strategy

In today's cloud-native landscapes, observability is more than a buzzword; it's a critical element for software development teams looking to master the complexities of modern environments like Kubernetes. There’s a multi-faceted nature to observability with all its various levels and dimensions — from basic metrics to comprehensive business insights. It’s complex and can continue indefinitely…if you let it.

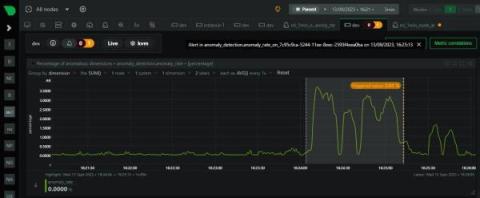
Our first ML based anomaly alert

Over the last few years we have slowly and methodically been building out the ML based capabilities of the Netdata agent, dogfooding and iterating as we go. To date, these features have mostly been somewhat reactive and tools to aid once you are already troubleshooting. Now we feel we are ready to take a first gentle step into some more proactive use cases, starting with a simple node level anomaly rate alert. note You can read a bit more about our ML journey in our ML related blog posts.

Deploying Single Node And Clustered RabbitMQ

RabbitMQ is a messaging broker that helps different parts of a software application communicate with each other. Think of it as a middleman that takes care of sending and receiving messages so that everything runs smoothly. Since its release in 2007, it's gained a lot of traction for being reliable and easy to scale. It's a solid choice if you're dealing with complex systems and want to make sure data gets where it needs to go.

Hyperview Integrates Digitalor for Rack-Unit RFID Asset Tracking and Environmental Sensors

Vancouver, BC—September 13, 2023— Hyperview, a leading cloud-based data center infrastructure management (DCIM) platform provider, and Digitalor, a global leader in rack-unit MC-RFID asset tracking, have announced a strategic partnership that offers Hyperview users automated, real-time life cycle management for data centers and hybrid IT environments.

Why GDIT Chose D2iQ for Military Modernization

General Dynamics Information Technology (GDIT) is among the major systems integrators that have chosen D2iQ to create Kubernetes solutions for their U.S. military customers. I spoke with Todd Bracken, GDIT DevSecOps Capability Lead for Defense, about the reasons GDIT chose D2iQ and the types of solutions his group was creating for U.S. military modernization programs using the D2iQ Kubernetes Platform (DKP).