Operations | Monitoring | ITSM | DevOps | Cloud

Incident severity: why you need it and how to ensure it's set

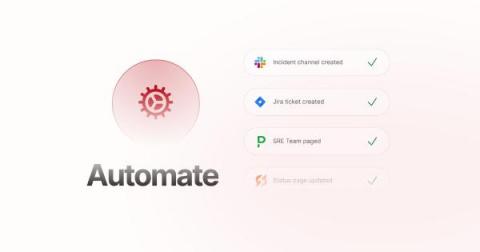
Defined severity levels quickly get responders and stakeholders on the same page on the impact of the incident, and they set expectations for the level of response effort — both of which help you fix the problem faster. But sometimes, for whatever reason, a severity level just doesn’t get set. Maybe there’s confusion around what severity level to use. Or maybe you have a low barrier to declaration and your responders just need a little nudge.

The Power of SCCM: A Deep Dive into System Center Configuration Manager

SCCM, standing for System Center Configuration Manager, now known as Microsoft Endpoint Configuration Manager, is a software suite from Microsoft’s stable of products. Often dubbed as the cornerstone of IT administration, SCCM offers a comprehensive management solution. It assists IT administrators in managing the deployment and security of devices and applications within an organization.

8 Ways to Meet Enterprise Network Service Level Agreements (SLAs)

Large cloud providers and ISPs offer service level agreements (SLAs) that guarantee uptime and help seal the deal with enterprises that value uptime. These same enterprises often ask IT to make the same guarantees for the performance and uptime of the internal network, its many varied connections and even the applications. At the same time, IT may have myriad SLAs from all kinds of vendors—including the aforementioned ISPs and cloud providers—it must manage.

Graphios - Connecting Graphite and Nagios

Graphios simplifies the process of sending Nagios performance data to backend systems like Graphite. With Graphios, users can easily integrate Nagios with Graphite, eliminating the need for complex scripts. This article explores Graphios' functionality, configuration, and installation process, empowering users to efficiently transfer Nagios data for monitoring and analysis.

Save 96% on Data Storage Costs

Users with real-time and other analytic workloads want or need to keep large volumes of historical data to aid in important activities, such as ad hoc historical trend analysis and training AI models. However, storing this much data in a way that also makes it easily queryable becomes prohibitively expensive. As a result, users must balance data availability and usability with sacrificing data fidelity and storage costs. That is until now.

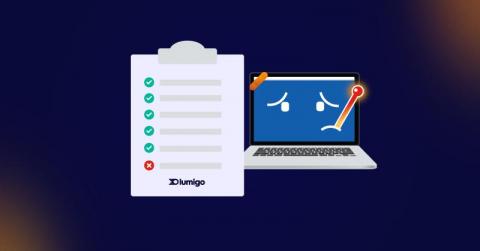
Troubleshooting Bad Health Checks on Amazon ECS

Health checks are an important factor when working with containerized applications in the cloud and are the source of truth for many applications in terms of their running status. In the context of AWS Elastic Container Service (ECS), health checks are a periodic probe to assess the functioning of containers. In this blog, we will explore how Lumigo, a troubleshooting platform built for microservices, can help provide insights into container crashes and failed health checks.

How to run faster Loki metric queries with more accurate results

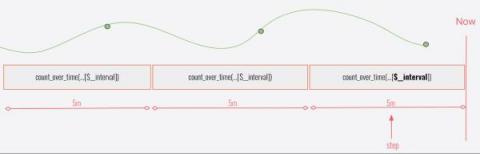
Today I want to talk about metric queries. More specifically, I want to talk about an important concept that is going to make your queries run faster, give you more accurate results, and make your Grafana Loki operators (like me) much happier. A metric query in Loki looks like this: And the part I want to talk about is that at the end. Now, if you’re like me and have a short attention span and are already bored — I understand.