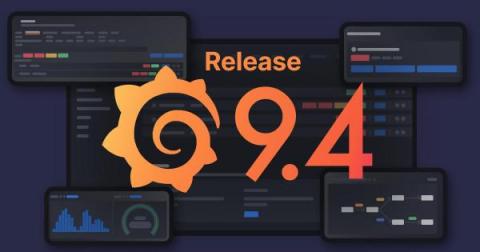
Grafana 9.4 is here! Get Grafana 9.4 With the latest Grafana release, we’re introducing a wealth of new features and improvements that makes getting started with Grafana even easier and that take your visualizations and observability best practices to the next level. In addition to enabling TraceQL, the new query language for distributed tracing in Grafana Tempo 2.0, for all Grafana Cloud users, the Grafana 9.4 release comes with a fresh round of features.
Meeting bandwidth capacity needs of customers is a crucial business objective for today’s providers. While both coarse wavelength-division multiplexing (CWDM) and dense wavelength-division multiplexing (DWDM) are modern forms of wavelength-division multiplexing (WDM) that effectively solve those increasing bandwidth needs by upgrading the utilization of new and existing fiber, they are each designed to tackle different network challenges.
In my first two blogs in this series, I looked at some of the obvious signs and not so obvious signs that it might be time to change your RMM. However, the reality is that most MSPs don’t want to change unless they really have to, and in many of the cases I’ve seen they’re prepared to let things be bad for way too long.
Effective troubleshooting and resolution of critical production issues require DevOps and R&D teams to utilize logging and observability. However, selecting the right logging solution can be challenging, given the wide range of available options and associated costs. Additionally, the strategy for logging usage should be tailored to the needs of different personas and use cases, such as DevOps engineers versus developers.