Better troubleshooting with a new Cloud Logging plugin for Grafana
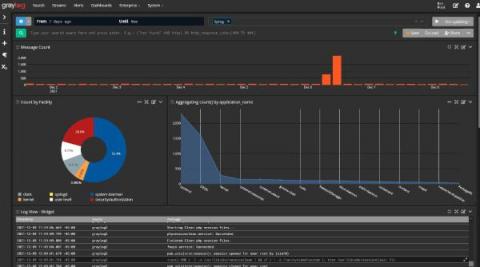
You can now use the Cloud Logging datasource plugin to view your logs in Grafana.


You can now use the Cloud Logging datasource plugin to view your logs in Grafana.
Cloud storage has become an essential component for businesses of all sizes. It allows you to store and access your data on a remote server, providing flexibility, scalability, and cost-effectiveness. However, with multiple cloud storage providers available, it can be challenging to choose the right one for your business needs. In this article, we will compare the three most popular cloud storage providers, GCP, Azure, and AWS, to help you make an informed decision.
The COVID-19 pandemic has upended varied operations, sectors, and industries, with customer support being no exception. According to a survey consisting of AI analysis of more than 1 million customer service calls by the Harvard Business Review, customer service is among the hardest-hit company functions by the COVID-19 pandemic. Hardly surprising.
On-call availability is crucial for many industries, especially in IT. With the growing reliance on IT systems and services, their availability directly impacts the success and satisfaction of customers. To ensure round-the-clock availability, on-call services are vital for prompt responses to emergencies and issues.
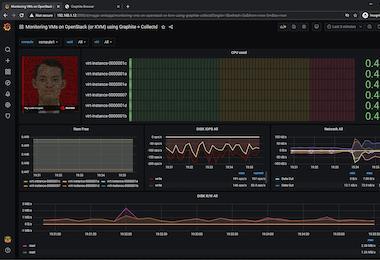
Graphite provides time-series metrics in an open-source database. With Graphite dashboards, you can see key performance indicators (KPIs) as well as other metrics visually. Dashboards typically display data as graphs, charts, and tables and can be customized to meet the specific needs of an organization. Using dashboards, organizations can monitor and analyze various aspects of their performance, such as system utilization, application performance, and resource utilization, using web interfaces.
In an online age, cyber security is more crucial than ever. It is essential to do business, socialize, and store sensitive information. It is crucial to stay secure online. Whether it's ransomware, phishing emails, or data breaches, countless potential sources of attack can have huge implications and expensive consequences. To keep data secure from cyberattacks, businesses must invest in robust cybersecurity solutions tailored specifically to their needs.
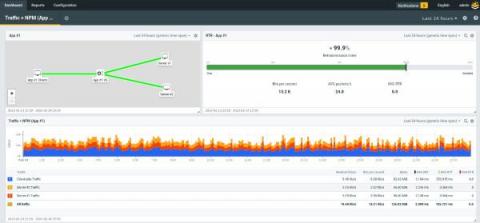
The Loadmaster Network Telemetry feature makes it easier than ever to get key insights on your applications into your Flowmon deployment. By creating both cluster-wide and application specific channels you can quickly build NPM dashboards and topologies that surface essential performance and availability metrics broken down by application, client and server.
When you’re adding or subtracting fractions, you need to make sure that they have a common denominator, a number that allows you to compare values. In the same way, your IT environment needs a common “language” for your event log data. Your environment consists of various devices running different operating systems, software, and firmware.