Operations | Monitoring | ITSM | DevOps | Cloud

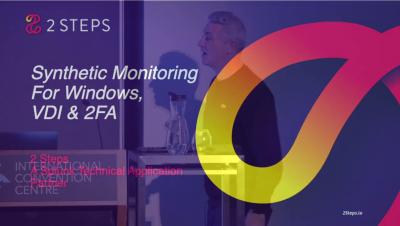
Synthetic Monitoring for Windows, VDI & 2FA | 2 Steps

We relate synthetic monitoring to a heart rate monitor for application performance. It fits hand in glove with real user monitoring and provides insights into how real customers and employees are experiencing the application. Historically, we’ve seen limitations with real user monitoring. If nobody is on the network or using the application, then you're not receiving any performance data. Also, the performance data that you typically receive is from a panel rather than every single user.

A technical deep dive into Kubeflow 1.6

Kubeflow 1.6 is finally here! 🎉🎉🎉 The open source MLOps platform of choice keeps evolving year over year, growing in popularity and available features. Learn about the technical aspects of the new release and listen to a deep dive into the new features with the engineering team of Charmed Kubeflow. We will be talking about pipelines, Katib and the news about the scheduler.

Should you measure developer productivity? @Sleuth TV

In episode 4 of Sleuth TV Live, Sleuth's CTO Don Brown and CEO Dylan Etkin had an engaging, insightful conversation about how DORA metrics connect to your people and how they play into developers' happiness. Check out specific points in the conversation: Resources mentioned in this episode: Give Sleuth a try and see why it's a deploy-based Accelerate / DORA metrics tracker both managers and developers love.

PagerDuty Apps for AWS + Automated Diagnostics Demo

Reduce downtime and customer impact with service ownership while enabling teams to drive continuous improvement and innovation Learn about how you can modernize and optimize your operations with our enterprise-grade set of AWS integrations. Automate incident response with PagerDuty’s Runbook Automation and learn about our new set of AWS plugins and prebuilt jobs that make it easier to get up and running with auto-diagnostics.