Kubernetes has multiple moving pieces that you need to monitor, such as the elements that make up the Control Plane. As your clusters grow, collecting metrics from all the Kubernetes sources becomes highly tedious. Comprehensive monitoring for Kubernetes reduces the operational complexity by providing the visibility you need to: Sysdig Monitor offers an out-of-the-box user experience for monitoring your Kubernetes environment, including pre-built dashboards and a comprehensive alerts library that you can use right away.
Watch Kamesh Sampath (Field Engineer, Solo.io) discuss Gloo Edge, Gateway API and API management on Kubernetes. Gloo Edge is a cloud-native API Gateway and Ingress Controller built on Envoy Proxy to facilitate and secure application traffic at the edge. Here we have covered the management and deployment if your API gateway with Gloo, and share how to set up and manage your APIs in less than 3 minutes!
Learn how you can easily discover MAC addresses within your local network and match them to IP addresses with the MAC Address Discovery tool from SolarWinds Engineer's Toolset. SolarWinds® Engineer’s Toolset (ETS) helps you monitor and troubleshoot your network with the most trusted tools in network management. Version 11.0 now comes with an intuitive web console for 5 of the most popular tools - Response Time Monitor, Interface Monitor, CPU Monitor, Memory Monitor, and TraceRoute.
Learn how ServiceDesk Plus' built-in #project_management module makes major change implementations simpler. Watch other features in ServiceDesk Plus: Follow us on social.
What are Service Accounts? Service Accounts are "headless" Cloud 66 accounts - they are like team members that cannot log into the UI. They allow you to set up automation tasks or notifications that are not bound to a real person's account.
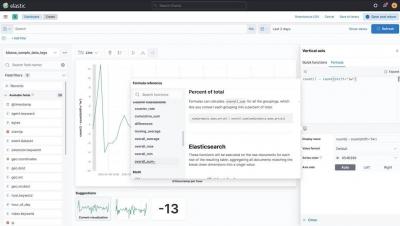
Ad hoc analysis capabilities in Kibana enable you to visualize your time series data easily and intuitively. In this video, learn how to use time shifts, advanced formulas, and dynamic colors in Kibana to examine data over different time periods, author your own metrics to use in visualizations, and highlight important values in tables.