Watch this video to learn about the features and benefits of the Home dashboard inside WhatsUp Gold, which is a great starting point to monitor your network devices and identify potential issues.
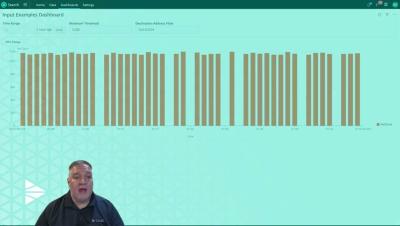
This video demonstrates how to create “inputs” to Cribl Search dashboards. An Input is a control widget that we can add to our Dashboards to control how they execute. They allow the user to supply a range of inputs to customize one or many of the Searches in each of the panels on a given dashboard.
Join us in this enlightening discussion with tech leaders Saiyam Pathak, Field CTO at Civo, and Matt Butcher, CEO at Fermyon. In this video, they explore ground-breaking topics such as Fermyon's Spin 2 the future of WebAssembly (Wasm) and how these technologies are shaping the tech landscape.
Join Nikita Koselev as he explores the transformative power of open source in shaping careers and creating value in the development world. Dive into the nuances of learning, sharing, and actively participating in open source projects. Discover the impact of visibility, especially for underrepresented groups, and learn how to balance giving back with receiving benefits. Nikita introduces various open source communities and resources, offering valuable tips for job searching and personal growth.
This video explains Entities List in Sumo Logic, its usage, and benefits. The video further demonstrates how to access and use the Entities List in the Sumo Logic Interface.
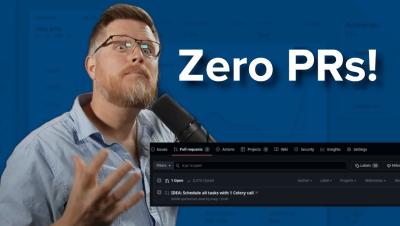
Pull requests are 99% waiting, and therefore waste, so in this video, you learn how to use Sleuth automations to minimize waiting and get back to doing real work. Give Sleuth a try and see how we give teams actionable insights on how to improve with no-code automations to instantly ship improvements, and metrics to measure their impact — all in a way that both managers and developers love.
Pull requests are 99% waiting, and therefore waste, so in this video, you learn how to use Sleuth automations to minimize waiting and get back to doing real work. Give Sleuth a try and see how we give teams actionable insights on how to improve with no-code automations to instantly ship improvements, and metrics to measure their impact — all in a way that both managers and developers love.
Having observability and monitoring solutions is a great way to gain insights into your applications' health, behavior, and performance. However, it doesn’t prevent incidents. Observability needs a partner, and this is where Grafana k6 can help you! In this video, Marie Cruz, a Developer Advocate at Grafana Labs, explores what Grafana k6 is, why it's the missing puzzle piece in your Grafana stack, and how to get started.