Operations | Monitoring | ITSM | DevOps | Cloud

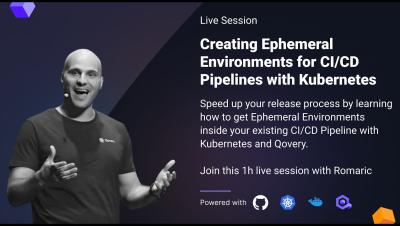
Creating Ephemeral Environments for CI/CD Pipelines with Kubernetes and Qovery

Ever feel like your release process is a slow, clunky old car? It's time to turbocharge that machine! Join me for a fun and interactive 1-hour LinkedIn Live Event where we’ll unlock the magic of ephemeral environments to get your releases zooming along the fast lane using Kubernetes, Qovery, and GitHub Actions.

Control Prometheus cardinality and metrics cost with Adaptive Metrics

Adaptive Metrics is a cost management feature in Grafana Cloud that helps enterprises control Prometheus cardinality and reduce their observability spend by identifying and eliminating unused metrics. Grafana Cloud customers using Adaptive Metrics see 20-50% reduction in their observability bill.

Zero-code application observability with Grafana Beyla and eBPF: demo

The eBPF-based OSS auto-instrumentation tool Grafana Beyla makes it easier to get started with application observability. Beyla provides RED (Rate, Errors, Duration) metrics through OpenTelemetry or Prometheus for your existing web services, whichever language they are written in. You don’t need to change any line of application code or configuration; you only need to deploy the Beyla in the same host as the service that you want to monitor. Collecting monitoring data with the eBPF autoinstrument tool has very low overhead, and allows you to capture data about your runtime, which is impossible with manual code instrumentation. Watch this in-depth demo of how to use Grafana Beyla to get started with application observability.

Resolve issues faster with Grafana Cloud Application Observability

Grafana Cloud Application Observability provides an out-of-the box experience to monitor application performance and minimize MTTR. With its native support of the open standards OpenTelemetry and Prometheus, Application Observability unifies signals across the full stack, accelerating root cause analysis while removing proprietary formats and vendor lock-in. Watch this demo of how to use Application Observability in Grafana Cloud.

What's New in Serverless360: Azure SQL Elastic Pool Support, Monitor Virtual Network Gateway & more

Serverless360's latest update, version 3.1.0, brings a suite of enhancements. These include Virtual Network Gateway Connection Monitoring for enhanced security and reliability within the Business Application component.

Retrace Keynote: Observability (metrics, traces, logs) - Take back control of your data

In the keynote recorded during our recent user group session NUGGETS 2023, Sanjeev Mittal, GM of Retrace talks about how organizations are rapidly moving their infrastructure to the cloud and how their costs and complexity are increasing. Our customers are looking for Observability solutions that give them control of data and costs.