Index data into Elastic Cloud from Confluent Cloud
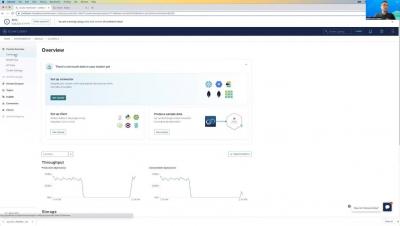
This short video tutorial guides you step-by-step into configuring the Elasticsearch Sink Connector to ingest in Elastic Cloud every kind of event from a Kafka topic hosted in Confluent Cloud.