Operations | Monitoring | ITSM | DevOps | Cloud
The latest News and Information on Log Management, Log Analytics and related technologies.
Reducing Your Splunk Bill With Telemetry Pipelines
With 85 of their customers listed among the Fortune 100 companies, Splunk is undoubtedly one the leading machine data platforms on the market. In addition to its core capability of consuming unstructured data, Splunk is one of the top SIEMs on the market. Splunk, however, costs a fortune to operate – and those costs will only increase as data volumes grow over the years. Due to these growing pains, technologies have emerged to control the increasing costs of using Splunk.
Optimizing Your Splunk Experience with Telemetry Pipelines
When it comes to handling and deriving insights from massive volumes of data, Splunk is a force to be reckoned with. Its ability to index, search, and analyze machine-generated data has made it an essential tool for organizations seeking actionable intelligence. However, as the volume and complexity of data continue to grow, optimizing the Splunk experience becomes increasingly important. This is where the power of telemetry pipelines, like Mezmo, comes into play.
How to Build a Culture of Data-Driven Product Management
Log Less, Achieve More: A Guide to Streamlining Your Logs
Businesses are generating vast amounts of data from various sources, including applications, servers, and networks. As the volume and complexity of this data continue to grow, it becomes increasingly challenging to manage and analyze it effectively. Centralized logging is a powerful solution to this problem, providing a single, unified location for collecting, storing, and analyzing log data from across an organization’s IT infrastructure.
Sumo Logic Brown Bag Session: Tips & Tricks on Creating Log Searches
Securely Connecting an Amazon S3 Destination to Cribl.Cloud and Hybrid Workers
There are several reasons you may want to route to Amazon S3 destinations, including routing to object storage for archival, routing to S3 buckets to utilize Cribl.Cloud’s Search feature, and archiving data that can be replayed later. When setting up Amazon S3 destinations in Cribl, there are three authentication methods: Auto, Manual, and Secret. Using the Auto authentication method paired with Assume Role is the most secure way to connect Amazon S3 to Cribl.
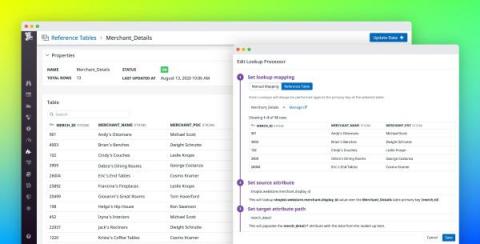
Add more context to your logs with Reference Tables
Logs provide valuable information for troubleshooting application performance issues. But as your application scales and generates more logs, sifting through them becomes more difficult. Your logs may not provide enough context or human-readable data for understanding and resolving an issue, or you may need more information to help you interpret the IDs or error codes that application services log by default.


