Operations | Monitoring | ITSM | DevOps | Cloud
The latest News and Information on Log Management, Log Analytics and related technologies.
Monitoring and troubleshooting - Apache error log file analysis
What is log management in DevOps?
What is log management in security?
What is log management used for?
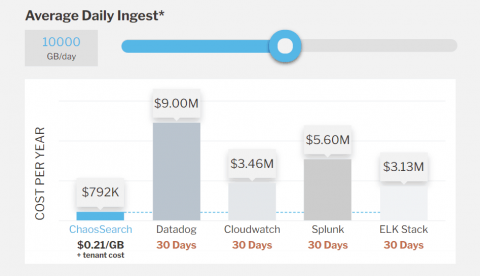
ChaosSearch Pricing Models Explained
How to Cut Through SIEM Vendor Nonsense
If you’re in need of new SIEM tooling, it can be more complicated than ever to separate what’s real and what’s spin. Yes, Logz.io is a SIEM vendor. But we have people in our organization with years of cybersecurity experience, and they wanted to share thoughts on how best to address the current market. Our own Matt Hines and Eric Thomas recently hosted a webinar running through what to look out for titled: Keep it SIEM-ple: Debunking Vendor Nonsense. Watch the replay below.
How to monitor Kafka and Confluent Cloud with Elastic Observability
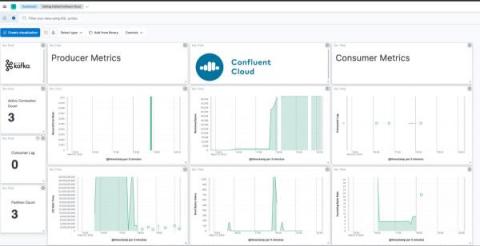
The blog will take you through best practices to observe Kafka-based solutions implemented on Confluent Cloud with Elastic Observability. (To monitor Kafka brokers that are not in Confluent Cloud, I recommend checking out this blog.) We will instrument Kafka applications with Elastic APM, use the Confluent Cloud metrics endpoint to get data about brokers, and pull it all together with a unified Kafka and Confluent Cloud monitoring dashboard in Elastic Observability.
Platform Engineering 101: Origins, Goals, DevOps vs SRE & Best Practices
Enhancing Datadog Observability with Telemetry Pipelines
Datadog is a powerful observability platform. However, unlocking it’s full potential while managing costs necessitates more than just utilizing its platform, no matter how powerful it may be. It requires a strategic approach to data management. Enter telemetry pipelines, a key to elevating your Datadog experience. Telemetry pipelines offer a toolkit to achieve the essential steps for maximizing the value of your observability investment. The Mezmo Telemetry Pipeline is a great example of such.


