Operations | Monitoring | ITSM | DevOps | Cloud
The latest News and Information on Log Management, Log Analytics and related technologies.
Beginner's Guide to Jaeger + OpenTracing Instrumentation for Go
This post aims to provide a very simple beginner’s guide to Jaeger + OpenTracing instrumentation for Go applications (the terms “application” and “service” is used interchangeably in this document) via a working example. If you are new to instrumentation, I recommend that you first read this post for a practical introduction to instrumentation for Jaeger and OpenTracing. You can also get more info on using logs in Go.
How JetBrains uses .NET, Elasticsearch, CSVs, and Kibana for awesome dashboards
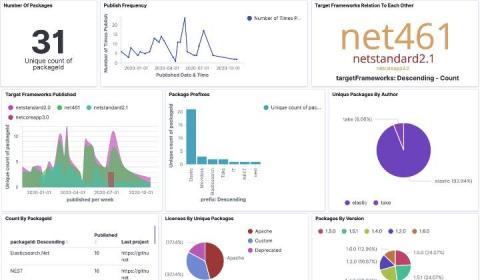
Recently, the JetBrains .NET advocacy team published a deep-dive post powered by data we retrieved from the official NuGet APIs with the goal of better understanding our community's OSS past and trying to predict trends into the future. This resulted in a giant dataset. Given our experience with Elasticsearch, we knew that the best tool to process millions of records was what we're calling the NECK stack: .NET, Elasticsearch, CSV, and Kibana.


