Operations | Monitoring | ITSM | DevOps | Cloud

The latest News and Information on Log Management, Log Analytics and related technologies.

How We Designed Loki to Work Easily Both as Microservices and as Monoliths

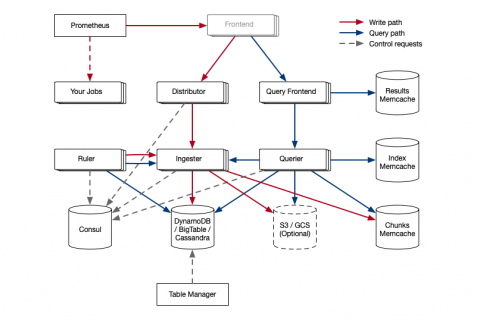
In recent years, monoliths have lost favor as microservices increased in popularity. Conventional wisdom says that microservices, and distributed systems in general, are hard to operate: There are often too many dependencies and tunables, multiple moving parts, and operational complexity.

The Top 5 Open-Source NIDS Solutions

In a hyper-connected world, the threat landscape is undoubtedly evolving. Ensuring the security of your enterprise networks on a daily basis is essential to protect your business, no matter how big (or small) it is. According to SophosLabs’ 2019 threat report, one dangerous ransomware called SamSam cost companies $6.5 million ($10K to $50K per ransom).

People-driven Documentation

Democratizing data is one of our key product goals, and we share a similar approach to content. With over half a million words, our Sumo Logic documentation set is a substantial amount of information to provide to our users on the various ways you can collect logs and metrics, query that information, and turn it into meaningful visualizations. But the real trick is making sure that people can find what they need quickly.

Sending Your VMWare vSphere Logs to LogDNA

Logging your virtual machines (VMs) is important, but what’s even more important is logging the hypervisors that run them. Hypervisors generate extremely useful data about the operation of your virtual machines and the environments that they run in. While VMs provide some information about their state, details such as VM performance, changes in state, errors, and security can only be found through hypervisor logs.

Collect Google Stackdriver logs with Datadog

Google Cloud’s Stackdriver Logging is a managed service that centralizes and stores logs from your Google Cloud Platform services and applications. We are excited to announce that Datadog’s GCP integration now includes Stackdriver Logging. You can collect all your GCP logs using Datadog so you can search, filter, analyze, and alert on them along with your metrics and distributed request traces in a single platform.

What's New in Elastic Stack 6.7

In the midst of all the turmoil and debate around Open Distro for Elasticsearch, Elastic continues to produce, and last week announced both a new major release of the Elastic Stack — version 6.7 (and also the first release candidate for 7.0!). As usual, I’ve put together a brief overview of the main features introduced. One change I’ve applied this time is adding a comment for each feature detailing what license it falls under.

Logging Fundamentals 1

Being inside a company that lives and breathes logging, observability and DevOps intelligence, sometimes it takes a moment to step back and explain what we do to friends, family and others. The simplest way we explain what LogDNA solves for companies with IT systems and software is similar to a blackbox on a plane that keeps a record of the flight data and the cockpit voice recorder.

Monitoring Kafka with Sematext

Monitoring Kafka is a tricky task. As you can see in the first chapter, Kafka Key Metrics to Monitor, the setup, tuning, and operations of Kafka require deep insights into performance metrics such as consumer lag, I/O utilization, garbage collection and many more. Sematext provides an excellent alternative to other Kafka monitoring tools because it’s quick and simple to use.