What's New in the Splunk Machine Learning Toolkit Version 4.1
What's new in the Splunk Machine Learning Toolkit version 4.1 and the machine learning universe.


The latest News and Information on Log Management, Log Analytics and related technologies.
Record keeping tasks such as data retention and disposal are an essential part of business management and regulatory compliance. At its core, data retention is about data control—meaning that an organization has taken steps to identify data throughout its organization, and then assess its importance, determine how long it will keep it, and then dispose of it.
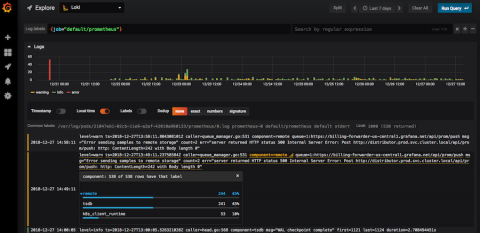
Loki and Grafana are a perfect match. The backend is kept lean and space-efficient, while the user interface allows ad-hoc field parsing and simple statistics. This post details some of the UX goals we had to deliver logs simpler and faster.
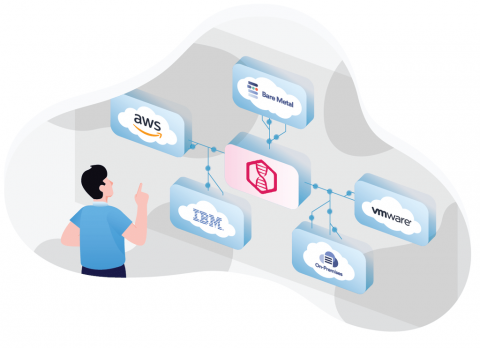
Multi-cloud is a cloud computing strategy that uses two or more different cloud services. This can be a combination of Software-as-a-Service (SaaS), Platform-as-a-Service (PaaS), or Infrastructure-as-a-Service (IaaS) solutions running in a public or private cloud environment. Multi-cloud offers a number of benefits including greater reliability and availability, less vendor lock-in, and potentially lower costs.
We performed a comparison between ELK log analysis tool and XpoLog log management tool. Main points to notice when considering using ELK for your log analysis Vs. XpoLog: 1. XpoLog provides a unique auto mining technology which profiles systems and app log data. XpoLog tool is able to build automatic IT intelligence which helps to understand the source of the problem and subsequently correlate and compute trends on those problems and then create the search analysis queries for the user.
Regardless of what language and framework you use, proper logging is crucial to web development. Logging is key when it comes to debugging and performance monitoring. Knowing how to properly use logging frameworks is an essential part of creating high quality software that is easy to debug.
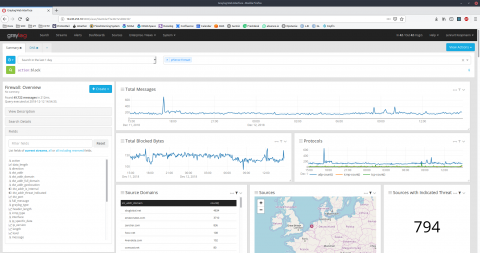
Today we are releasing Graylog v2.5.1 to fix a few bugs. Many thanks to our community for reporting issues and contributing fixes!
Observing modern applications is challenging. Microservices allow for applications that are not only more distributed but are made up of a number of different languages, frameworks, and backend services. DevOps teams have far greater flexibility in where and how they deploy applications,but when it comes time to collect logs, this flexibility can quickly become a hurdle.
At Honeycomb, we are frequently asked how we compare to what else is out there. Do these other tools offer observability? Do I need them all? What’s important? Metrics? Logs? What’s the best way to monitor application performance?